Tower Semiconductor (TSEM) said it plans to invest about $3B to expand its advanced semiconductor manufacturing capacity in Japan, backed by about $1B in grants from the Japanese government. The expansion is aimed at meeting rising demand from AI and data center
The price of Brent crude climbed to just over $84 a barrel after soaring nearly 10% on Monday. US benchmark crude was up 1.4% at $79.20 a barrel.
ADVERTISEMENT
ADVERTISEMENT
Oil prices are still below their wartime peak of nearly $120 a barrel, but uncertainty over the future stability of supplies deepened as the US and Iran each asserted they controlled the Strait of Hormuz.
US share futures were down 0.3% as the U.S. launched more strikes on Iran after President Donald Trump said Washington was “reinstating” a blockade on Iran in the strait.
Fighting in the region has kept oil tankers from using the waterway to deliver crude to customers from the Persian Gulf, driving up fuel prices worldwide.
Asia-Pacific shares slip overnight
In Asian trading, Tokyo’s Nikkei 225 lost 1% to 66,574.96 and the Kospi in South Korea declined 3.2% to 6,589.37.
The Shanghai Composite index lost 0.8% to 3,884.32, even though the government reported that China’s exports jumped 27% in June from a year earlier as adoption of artificial intelligence drove strong demand for computer chips and other technology.
Hong Kong’s Hang Seng edged 0.1% higher, to 24,230.46, while in Australia, the S&P/ASX 200 shed 0.5% to 8,767.00.
Monday on Wall Street, the S&P 500 fell 0.8%, coming off its fourth winning week in the last five. The Dow Jones Industrial Average dropped 0.3%, and the Nasdaq composite sank 1.6%.
Chip stocks like Micron Technology helped lead the way lower. Micron fell 4.4%, eating into what had been a stellar rise of 243.1% for the year so far.
Worries are rising that stock prices have shot too high and that the demand may not be sustainable if AI doesn’t deliver as much profit and productivity as expected.
Nvidia fell 3.5%. Because it’s the largest stock on Wall Street by value thanks to the euphoria around AI, it was the single heaviest weight on the S&P 500.
Investors turn to earnings
Much of Wall Street’s attention this week will be on profit reports from companies saying how much they earned during the spring. On Tuesday alone, Bank of America, Citigroup, JPMorgan Chase, Goldman Sachs and Wells Fargo are all releasing their latest quarterly results.
Analysts are forecasting that companies in the S&P 500 index will deliver overall growth of 23.6% from a year earlier, according to FactSet. If they’re right, it would be the second straight quarter of growth better than 20%.
Companies across industries will need to deliver strong growth to justify the big moves their stock prices have made. Indexes are near records despite their sharp recent swings due to worries around AI stocks.
More costly oil would push inflation higher, potentially leading the Federal Reserve and other central banks to raise interest rates. Higher rates can keep a lid on inflation, but they also slow the economy and hurt prices for all kinds of investments.
In other dealings early Tuesday, the US dollar slipped to 162.34 Japanese yen from 162.35 yen. The euro rose to $1.1391 from $1.1381.
A memorandum of understanding brokered Monday between HHS and the Veterans Administration could bode well for companies developing psychedelic-based drug treatments.
The MOU is intended to bolster “collaboration on the research, clinical development, and responsible deployment to veterans suffering from serious mental health
Sunrun (RUN) is piloting a program that would allow customers to earn hundreds of dollars per month by using electricity from rooftop solar installations to power home-computing systems for artificial intelligence, CEO Mary Powell said Monday.
Front-month gold futures plunged below $4,000/oz Monday after fresh strikes between the U.S. and Iran sent oil prices surging higher, reviving concerns about inflation and the potential for tighter monetary policy.
The latest escalation and President Trump’s declaration that the
Thomson Reuters (TRI) is planning to eliminate up to 500 engineering jobs, the firm’s media arm reported on Monday.
The layoffs affect about 5.2% of the company’s 9,400 employees in its operations and technology unit. It represents about 1.8% of its overall workforce of
TD Bank Group’s (TD) merchant solutions business unit will offer the Clover commerce platform in Canada to help its clients accept payments and manage their business through a single, integrated ecosystem, the company said Monday.
Halliburton (HAL) up 2.5% in Monday’s trading after saying it secured major integrated drilling and completions contracts for the GranMorgu deepwater development offshore Suriname operated by TotalEnergies (TTE); financial terms were not disclosed.
The Ethiopia-Djibouti corridor sits at the centre of this transformation, serving as the primary gateway for Ethiopia’s import and export flows.
For financial institutions such as iibGroup, the role of banking extends well beyond liquidity provision. It is about deploying capital to support economic resilience, strengthen trade ecosystems, and deliver measurable social and environmental impact.
Embedding Sustainability at Scale
Unlike traditional ESG approaches that operate as standalone initiatives, iib East Africa integrates sustainability directly into its core financing model. As of 2025, over 80% of the bank’s loan portfolio was aligned with ESG-related financing, reflecting a deliberate shift towards impact-driven banking.
This represents a 20% increase in ESG-aligned financing since January 2025, driven by growth in renewable energy, infrastructure financing and trade finance solutions for ESG-compliant businesses. This scale of integration positions iib as the leading ESG-focused financial institution in Djibouti.
Supporting Trade Through ESG-Aligned Finance
Trade finance remains central to East Africa’s economy, yet many SMEs in essential sectors continue to face limited access to structured financing.
iib East Africa has expanded its dedicated trade finance facilities for ESG-compliant SMEs, particularly those involved in food import/export and essential goods. These facilities support regional food security, responsible supply chains and cross-border trade resilience.
By aligning trade finance with ESG principles, the bank ensures capital supports not only commercial growth, but also broader economic stability and sustainability.
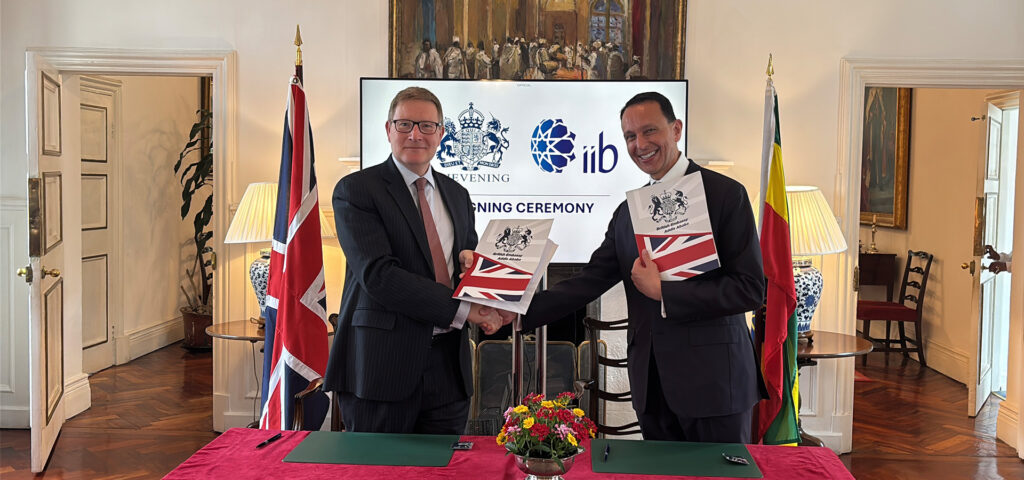
H.E. Darren Welch, UK Ambassador to Ethiopia & Permanent Representative to the African Union, and Sohail Sultan, Chairman of iibGroup at the signing ceremony for the Chevening Scholarship partnership in Addis Ababa.
Mobilising Capital for High-Impact Projects
Beyond trade finance, iib is mobilising capital at scale through structured sustainable finance initiatives.
A significant development is a pipeline of approximately US$72.5 million, comprising a planned US$30 million social bond programme, a US$25 million Green Bond, and a US$17.5 million Blue Carbon programme.
The social bond programme is designed to finance high-impact projects including affordable housing, regional food security, essential infrastructure for telecommunications, education and healthcare, and capital for ESG-aligned SMEs.
The Green Bond will improve the energy efficiency of industrial and logistics SMEs.
Meanwhile, the Blue Carbon programme will restore 1,675 hectares of mangroves, preserve a further 780 hectares, establish a 400-hectare protective green barrier and target the sequestration of 2 million tonnes of CO₂. And with a projected investment of US$17.5 million and an expected IRR exceeding 20%, it demonstrates how sustainable finance can generate both commercial returns and measurable environmental outcomes.
Expanding into Ethiopia
By establishing a Representative Office in Addis Ababa, iibGroup has taken an important step in extending this model into one of Africa’s largest and most promising markets.
This expansion supports iib’s strategy of operating as a regional financial intermediary, facilitating cross-border trade, investment and capital flows between East Africa and international markets.
Backed by a robust correspondent banking network of more than 30 relationships across Ethiopia and the wider region, the bank provides trade finance, structured trade, cross-border payments, foreign exchange settlement, liquidity management and risk participation solutions.
Through its presence in Djibouti and Ethiopia, iib is positioned to connect local businesses with international capital while supporting trade, infrastructure and private-sector growth across the corridor, reinforcing its role as a regional connector.
Driving Social Impact Beyond Financing
In frontier markets, sustainable finance extends beyond balance sheet activity. iib East Africa complements its financing activities with direct community engagement that promote inclusive growth.
In 2025, this included:
Food distribution initiatives targeting vulnerable communities.
Literacy programmes and education support.
Environmental campaigns including beach clean-ups and tree planting.
Health awareness initiatives, including breast cancer awareness programmes.
Additionally, the bank is financing a housing project in partnership with Qatar Charity, involving the construction of 79 houses, plus a mosque and Islamic academic centre, representing a total investment of approximately US$500,000.
These initiatives reinforce the principle that sustainable finance should create both institutional and community impact.
A Model for Sustainable Banking in Frontier Markets
As East Africa’s financial systems continue to evolve, banks are becoming active enablers of economic development rather than just financial intermediaries.
iibGroup’s approach – anchored in ESG integration, trade facilitation and capital mobilisation – demonstrates how sustainable banking can be implemented effectively in frontier markets. By aligning financial performance with measurable impact, the bank is contributing to the development of a more resilient, inclusive and interconnected regional economy. Along the Ethiopia–Djibouti corridor, this model is not only relevant; it is essential.
Suntory PepsiCo, a joint venture between Japan’s Suntory Beverage & Food Limited (STBFY) and US-based PepsiCo (PEP) has opened its largest manufacturing facility in Asia in Southern Vietnam, investing $300 million as it expects rising incomes and changing consumer
The benchmark S&P 500 (SP500) has posted a respectable 10.1% gain year-to-date, yet a select cohort of 15 stocks within the index has delivered triple-digit returns of 100% or more, significantly influencing the benchmark’s performance.
Kratos Defense & Security Solutions (KTOS) Monday said that the company has recently received an approximate $100M sole-source prime contract award for the production of a ground-based modular space domain awareness system.
Due to security-related, competitive, and other considerations, no additional information will
TSMC said on Monday that June revenue rose 67.9% year on year to NT$398.27 billion (€10.8bn), bringing the first-half of the year revenue to NT$2.4 trillion (€65.4bn), a 35.6% increase from the same period in 2025.
ADVERTISEMENT
ADVERTISEMENT
Based on the company’s monthly revenue disclosures, second-quarter revenue amounted to roughly NT$1.27 trillion, ahead of the NT$1.264 trillion (€34.4bn) consensus forecast from 20 analysts surveyed by LSEG.
Monday’s release covers June revenue and cumulative first-half sales only.
TSMC will publish its full second-quarter earnings on Thursday, including net profit, gross margin, operating margin and updated financial guidance.
The road ahead
At its April earnings presentation, TSMC said it expects full-year 2026 revenue to grow by more than 30% in US dollar terms and projected capital expenditure of between $52 billion (€45.5bn) and $56 billion (€49bn) as it expands manufacturing capacity to meet AI-driven demand.
New fabrication plants are under construction or in preparation in Arizona, Japan and Germany, reflecting both the scale of customer demand and government efforts to strengthen domestic semiconductor manufacturing.
Shares in TSMC rose about 1% following Monday’s revenue update.
Investors will now turn their attention to Thursday’s full earnings report for updates on profitability, margins, full-year guidance and the rollout of the company’s two-nanometre manufacturing technology, which is already attracting strong customer interest.
The AI engine
The company sits at the centre of one of the largest investment cycles in the semiconductor industry’s history.
Many of the world’s leading AI processors, including Nvidia’s GPUs and much of the custom AI silicon designed by Amazon, Google and Microsoft, are manufactured by TSMC in Taiwan.
At the company’s April earnings presentation, CEO Che-Chia Wei described AI demand as “extremely robust”, driven by the shift from chatbots that answer questions to agentic AI systems capable of taking actions.
That transition requires significantly greater computing power, increasing demand for the advanced chips TSMC manufactures.
Advanced technologies, defined as chips produced using process technologies of seven nanometres or smaller, accounted for 74% of wafer revenue in the first quarter.
TSMC’s three-nanometre technology alone contributed 25% of wafer revenue.
Reports have indicated that Nvidia has reserved roughly 60% of TSMC’s advanced chip-packaging capacity for 2026, highlighting continued supply constraints across the AI semiconductor market.
India’s primary bourse preps a landmark IPO alongside Jio, testing markets amid a global slowdown.
India’s National Stock Exchange (NSE) has filed for an initial public offering with the Securities and Exchange Board of India, in what is expected to be one of the most consequential listings in the country.
The official filing document revealed that a ceiling of nearly 149 million shares, each with a face value of 1 rupee (about one U.S. cent), is being offered. The NSE is India’s primary bourse and the leading market infrastructure company in the Indian capital markets.
Its IPO has been a long-awaited event, providing major investors — including the State Bank of India, the country’s largest public-sector bank; Singapore’s global investment firm Temasek; and Canada’s Pension Plan Investment Board — with an opportunity to monetize their stakes.
Formed by large Indian financial institutions, the NSE has attracted investors from global financial institutions and individual investors, has more than 35,000 individual shareholders, and has created long-term value.
India’s IPO boom in recent years has sharply waned, with the Iran conflict a significant geopolitical headwind for deal flow.
This is reflected internationally, according to S&P Global, which reported in a recent report that IPOs worldwide have fallen to their lowest level since the height of the COVID-19 pandemic. During the first quarter of 2026, completed global IPO transactions fell to 294, compared with 451 in the final quarter of last year.
A Definitive Market Test
Market sentiment in India may be shifting as IPOs on the NSE, including those of its largest telecom operator, Jio Platforms, are underway, with Jio Platforms having filed a draft prospectus for a public flotation.
The NSE IPO is entirely an offer for sale proposal, where investors may reallocate funds to their headquarters on a global scale after raising liquidity and reducing NSE stakes.
“NSE, along with JIO Platform’s IPO, will not only showcase the depth of India’s capital markets but also the confidence of global and domestic investors in India’s markets,” said Sanjay Doshi, head of KPMG India’s financial services advisory.
Shareholders earned handsome returns, and some may have made more than 10 times their investment in a company that has adopted technology since its inception, he added.
Ajay Shamdasani is a contributing writer based in Hong Kong.
SK Hynix (SKHYV) has detailed its comprehensive financial health and operational performance for the three months ended March 31, 2026, in its recent Form F-1 filing with the U.S. Securities and Exchange Commission.
The price of Brent crude, the international benchmark, gained 3.9% to $78.96 per barrel, while the US benchmark crude oil price rose 4% to $74.26 per barrel.
ADVERTISEMENT
ADVERTISEMENT
Prices for both types of crude oil had recently slipped back to the levels seen before the war with Iran began, after the two sides reached an interim agreement to end the conflict and ships resumed transporting oil through the Strait of Hormuz.
However, the United States launched several waves of strikes on Iran early on Monday morning following an Iranian attack on a container ship in the Strait of Hormuz that set the vessel ablaze and left one crew member missing over the weekend. Iran retaliated by targeting countries across the Middle East.
US stock futures fell, with the contract for the S&P 500 down 0.4% and that for the Dow Jones Industrial Average 0.3% lower. Nasdaq Composite futures lost 1%.
In Asian trading, Tokyo’s Nikkei 225 index lost 1.1% to 67,786.86, while in Seoul, the Kospi declined 5.6% to 7,060.69.
Shares in South Korean memory chipmaker SK Hynix, which soared 13% on their Wall Street debut on Friday, slumped 10.6% in Seoul. Its bigger rival, Samsung Electronics, fell 6.7%.
Elsewhere in Asia, Hong Kong’s Hang Seng edged 0.1% higher to 24,202.41, and the Shanghai Composite index shed 1.2% to 3,947.34.
In Australia, the S&P/ASX 200 declined 0.3% to 8,777.00.
US stocks ticked higher on Friday after investors showed sustained appetite for winners of the artificial intelligence (AI) boom. The S&P 500 rose 0.4% and the Dow Jones Industrial Average added 0.3%. The Nasdaq Composite climbed 0.3%.
SK Hynix’s shares jumped after trading began at midday after it raised roughly $26.5 billion by selling American depositary shares at a price of $149 each.
SK Hynix’s stock in Seoul had already surged more than 600% over the past year thanks to enthusiasm for AI. The boom has translated into real profits, driven by soaring demand for computer memory. But it has also raised concerns that AI stock prices have climbed too high and that the world’s spending on chips and data centres will not generate enough productivity and profit growth to justify the investment.
That has led to sharp swings in AI stocks, which have become some of Wall Street’s most influential because of their enormous market values.
Nvidia was the single biggest force lifting the S&P 500 on Friday, rising 4%.
Beyond the uncertainty surrounding AI, investors are turning their attention to the upcoming corporate earnings season.
Companies across industries will need to deliver strong profit growth to justify their elevated share prices, which remain close to record highs. This week will bring earnings reports from many of the biggest US banks, including Bank of America, Citigroup, JPMorgan Chase, Goldman Sachs and Wells Fargo, with several reporting on Tuesday alone.
Concerns about how the continued fighting with Iran will affect the global flow of crude oil are clouding the outlook for both energy costs and overall inflation.
High bond yields have been weighing on financial markets worldwide because more expensive oil and persistently high inflation could prompt the Federal Reserve and other central banks to raise interest rates.
Higher interest rates can help keep inflation under control, but they also slow economic growth and weigh on the prices of all kinds of investments.
Ford Motor (F) has reached a tentative three-year labor agreement with Canadian auto union Unifor, covering more than 5,000 unionized employees in Canada, the automaker said Saturday.
Financial terms and other details were not immediately disclosed. The agreement still must be
U.S. Sen. Lindsey Graham, a longtime Republican lawmaker from South Carolina and one of President Donald Trump’s closest allies on Capitol Hill, has died at the age of 71 following a brief and sudden illness, according to a statement from his office. No cause of death
Tesla (TSLA) delivered a record 480,126 vehicles in Q2 2026, up 25% year-over-year, while producing about 452,000 vehicles during the quarter. Despite the strong delivery beat, shares slumped 8% following the report, with the stock now down more than 9% year