Netflix stock plunged 9% on Friday morning to $67.74 a share, after the streamer’s second quarter earnings report renewed concerns among investors and analysts about the streamer’s future growth.
The Los Gatos-based company on Thursday narrowed its 2026 forecast to $51 billion to $51.4 billion from $50.7 billion to $51.7 billion, causing equity analysts to cut their estimates. The stock reached a new 52-week low on Friday and is down 49% from a year ago.
“This outlook likely reinforces investor concerns,” wrote analysts from Guggenheim Securities in a research note on Friday, which has a “buy” rating on the stock.
Netflix did not immediately respond to a request for comment on its declining stock price.
Investors have been skittish about the amount of time people spend on the streaming platform. Netflix’s share of TV viewing time in the U.S. has steadily declined in recent months as YouTube has gained market share, according to Nielsen data.
Investors are concerned that if people spend less time watching Netflix, it could cause people to cancel their subscriptions and make it more challenging for Netflix to raise prices in markets like the U.S.
Netflix said engagement is healthy on its platform and its programs continue to draw large audiences with popular shows like crime drama series “I Will Find You.”
Netflix said subscribers watched more than 97 billion hours on the streaming service in the first half of the year, up 2% from a year ago.
“We are increasingly concerned that younger generations are less interested in long form content as their time migrates to ‘free’ social media platforms,” wrote Jeffrey Wlodarczak, CEO of Pivotal Research Group in a report on Friday, who has a hold recommendation on Netflix stock. “We believe this will result in slower subscriber growth and attempts by the company to offset this via more aggressive price increases and investment in content.”
Netflix executives in a Thursday earnings presentation emphasized that measuring engagement at the company goes beyond hours spent watching the streaming service.
“There is not a linear relationship between view hours and revenue and profit because all hours are not created equal,” said Greg Peters, Netflix co-CEO on an earnings presentation on Thursday. “All hours don’t provide the same kind of value to the business.”
The streamer said it plans to allocate just over 5% of its content spend on live programming this year. Live content has been a key driver for subscriptions, accounting for six of the top 10 new member sign-up days over the last five years, the company said, even though it makes up roughly 1% of overall watch time this year.
The company is also diversifying the content it offers on its platform, adding live sports games and video podcasts, in addition its large library of TV shows and movies.
Netflix revenue rose 13% to $12.6 billion in the second quarter. Net income was $3.4 billion, up 9% from a year ago.
The company said its advertising business is on track to reach $3 billion in revenue this year, double the amount in 2025.
Netflix on Thursday reported higher revenues and profit in the second quarter as it sought to assure investors about its growth prospects.
The streaming giant reported revenue of $12.6 billion in the second quarter, up 13% from a year ago. Net income during the period rose 9% to $3.4 billion.
Netflix said it expects revenue to grow 12% in the third quarter, but lowered its 2026 revenue forecast to $51 billion from $51.4 billion.
The results were roughly in line with what analysts had predicted and were driven by recent price increase and growth in advertising revenue. The latter is expected to reach $3 billion this year, the company said.
In a presentation with analysts, Netflix executives touted global expansion plans.
“We’re entertaining an audience approaching a billion people with still lots of room to grow into our addressable market on every measure,” said Spencer Neumann, Netflix’s chief financial officer, in the earnings presentation. “We believe we’ve got lots and lots of runway for solid growth ahead of us.”
Those comments appeared intended to assuage investors who’ve grown concerned that people could be spending less time on the streaming service as rivals like YouTube gain market share.
Netflix’s share of TV viewing time in the U.S. has steadily declined in recent months as rivals have gained market share, according to Nielsen data.
The streamer represented 7.8% of all TV viewing in the U.S. in April — the lowest percentage since May 2025. It was 7.5% in April 2025, Nielsen said.
By comparison, YouTube has seen its share of the streaming audience grow. YouTube’s TV viewing share in April rose to 13.4%, up from 12.4% a year earlier, Nielsen said.
Some investors fear that if viewership is down, subscribers could cancel the service, which would negatively affect the platform’s growing advertising business. It could also undercut Netflix’s ability to raise prices in the U.S. and other countries.
Those worries have caused Netflix’s stock price to plummet 41% in the last year. The stock closed on Thursday at $74.35 a share, up 1%. In after hours trading, the stock fell 8%.
“The engagement elephant continues to rear its head and investors are on edge that an earlier price hike in a seasonally tough period and lighter content slate could have driven more churn than usual,” wrote Morgan Stanley Research analysts in a research note.
On Thursday, Netflix said in a letter to shareholders it has a sophisticated understanding of its consumers and “we know not all hours are equal” and that engagement on its platform is “healthy.”
“The entertainment industry remains dynamic and competitive,” Netflix told shareholders. “We aim to stay ahead by executing against our three areas of focus: delivering more entertainment value, leveraging technology to improve every aspect of our service, and improving monetization.”
The Los Gatos-based company said it plans to allocate more than 5% of its content spend on live programming this year. Live content has been a key driver for subscriptions, accounting for six of the top 10 new member sign-up days over the last five years, the company said.
In the first half of 2026, Netflix said members watched more than 97 billion hours, up 2% from a year ago. Among the most popular shows: the crime thriller “I Will Find You,” which had 87 million views; and the romantic comedy film “Voicemails for Isabelle,” which garnered 71 million views.
Netflix has been adding new types of content to its platform, including video podcasts to help increase engagement with subscribers during the day.
As part of the diversification efforts, the platform has expanded its portfolio of live programming over the years, including adding NFL games and streaming Major League Baseball’s opening day game.
“The third quarter reflected continued progress across our strategic priorities. Revenue and enrollment were generally consistent with prior year, supported by continued strength in retention and healthy growth in employer-supported
Seeking Alpha’s Disclaimer:This article was automatically generated by an AI tool based on content available on the Seeking Alpha website, and has not been curated or reviewed by humans. Due to inherent limitations in using AI-based tools, the accuracy, completeness, or timeliness of such articles cannot be guaranteed. This article is intended for informational purposes only. Seeking Alpha does not take account of your objectives or your financial situation and does not offer any personalized investment advice. Seeking Alpha is not a licensed securities dealer, broker or US investment adviser or investment bank.
Earnings Call Insights: Kestra Medical Technologies (KMTS) Q4 fiscal 2026
Management View
“We concluded fiscal 2026 with another strong quarter” and “Revenue was $28.6 million” alongside “over 6,300 prescriptions written for the ASSURE system,” Brian Webster said (Founder, President, CEO & Director Brian Webster).
Seeking Alpha’s Disclaimer:This article was automatically generated by an AI tool based on content available on the Seeking Alpha website, and has not been curated or reviewed by humans. Due to inherent limitations in using AI-based tools, the accuracy, completeness, or timeliness of such articles cannot be guaranteed. This article is intended for informational purposes only. Seeking Alpha does not take account of your objectives or your financial situation and does not offer any personalized investment advice. Seeking Alpha is not a licensed securities dealer, broker or US investment adviser or investment bank.
TSMC said on Monday that June revenue rose 67.9% year on year to NT$398.27 billion (€10.8bn), bringing the first-half of the year revenue to NT$2.4 trillion (€65.4bn), a 35.6% increase from the same period in 2025.
ADVERTISEMENT
ADVERTISEMENT
Based on the company’s monthly revenue disclosures, second-quarter revenue amounted to roughly NT$1.27 trillion, ahead of the NT$1.264 trillion (€34.4bn) consensus forecast from 20 analysts surveyed by LSEG.
Monday’s release covers June revenue and cumulative first-half sales only.
TSMC will publish its full second-quarter earnings on Thursday, including net profit, gross margin, operating margin and updated financial guidance.
The road ahead
At its April earnings presentation, TSMC said it expects full-year 2026 revenue to grow by more than 30% in US dollar terms and projected capital expenditure of between $52 billion (€45.5bn) and $56 billion (€49bn) as it expands manufacturing capacity to meet AI-driven demand.
New fabrication plants are under construction or in preparation in Arizona, Japan and Germany, reflecting both the scale of customer demand and government efforts to strengthen domestic semiconductor manufacturing.
Shares in TSMC rose about 1% following Monday’s revenue update.
Investors will now turn their attention to Thursday’s full earnings report for updates on profitability, margins, full-year guidance and the rollout of the company’s two-nanometre manufacturing technology, which is already attracting strong customer interest.
The AI engine
The company sits at the centre of one of the largest investment cycles in the semiconductor industry’s history.
Many of the world’s leading AI processors, including Nvidia’s GPUs and much of the custom AI silicon designed by Amazon, Google and Microsoft, are manufactured by TSMC in Taiwan.
At the company’s April earnings presentation, CEO Che-Chia Wei described AI demand as “extremely robust”, driven by the shift from chatbots that answer questions to agentic AI systems capable of taking actions.
That transition requires significantly greater computing power, increasing demand for the advanced chips TSMC manufactures.
Advanced technologies, defined as chips produced using process technologies of seven nanometres or smaller, accounted for 74% of wafer revenue in the first quarter.
TSMC’s three-nanometre technology alone contributed 25% of wafer revenue.
Reports have indicated that Nvidia has reserved roughly 60% of TSMC’s advanced chip-packaging capacity for 2026, highlighting continued supply constraints across the AI semiconductor market.
Foxconn’s (FXCOF) June revenue surged 52.11% year-over-year, and it forecast a growth outlook for the third quarter but cautioned about a “volatile global political and economic situation.”
The company saw a record second quarter revenue, which also beat analysts expectations, on strong demand
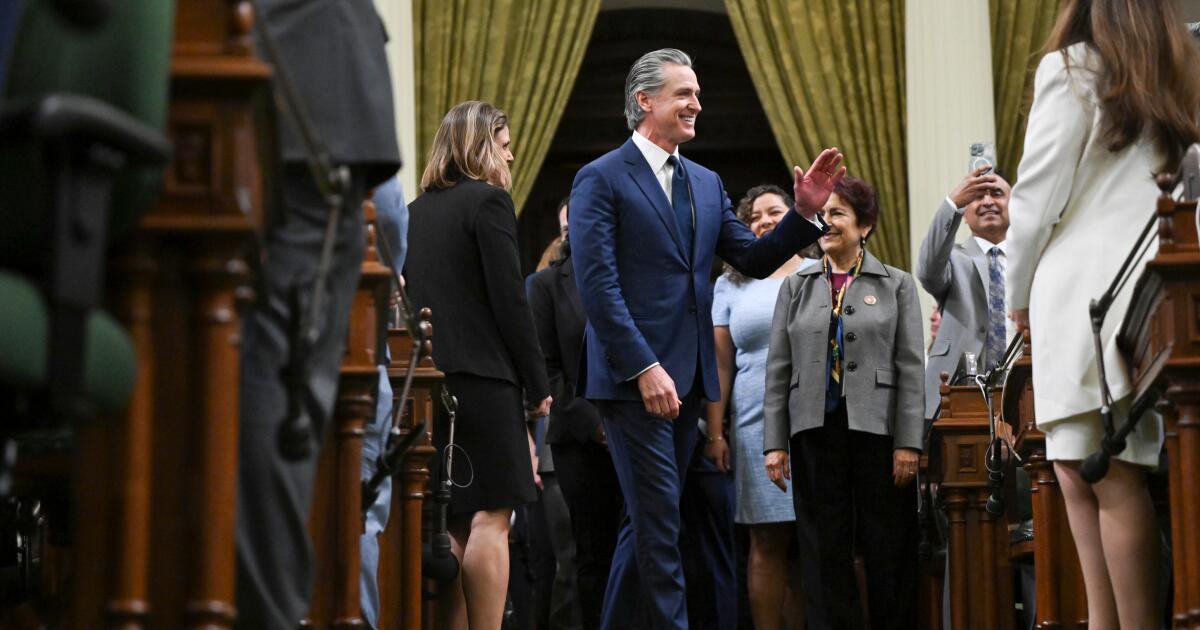
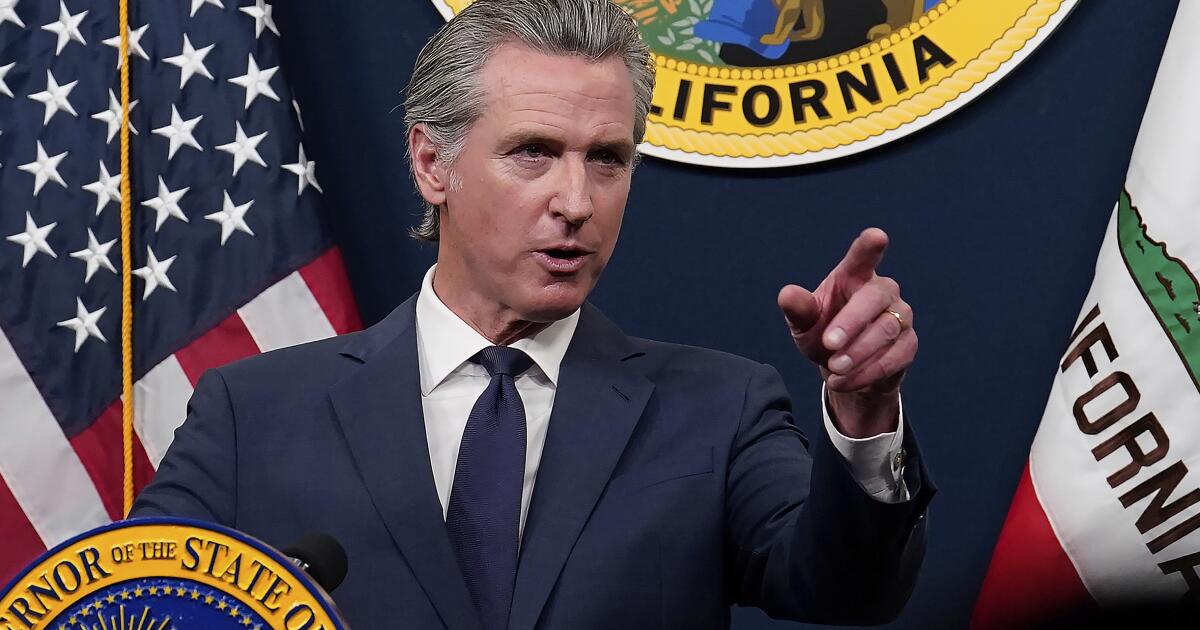
SACRAMENTO — Gov. Gavin Newsom reached an agreement Friday with legislative leaders on a $351.7-billion state budget in his final year as governor, a spending plan that uses a tax windfall to avoid major cuts and lessen California’s chronic deficit in the years ahead.
The deal provides nearly $2 billion in state revenue next year through tax hikes on corporations, new levies on software sales and a revamped tax on managed healthcare organizations. Lawmakers and the governor continue major investments in education, healthcare and agreed to increase spending on subsidized childcare and affordable housing.
“We want to leave the next governor not only a balanced budget, but a budget that is substantially structurally sound, and we’re going to accomplish that,” Newsom said in an interview Friday. “We were very cautious in terms of new spending,”
The agreement ends weeks of lobbying by outside interests and negotiations among lawmakers and the governor at the state Capitol about how to handle a surge of income tax collected on stock market gains related to artificial intelligence.
Early forecasts last June projected a $12.6-billion deficit in 2026-27, according to the California Department of Finance. Updated predictions now suggest the state will end the year with a surplus of $4.5 billion.
Democrats, following Newsom’s lead, are tucking away $6.4 billion for future years, which allows the governor to knock down a deficit previously projected through 2027-28 and assuage criticism about his spending habits.
But economists say the fix and revenue increase is likely only temporary.
Spending in California has generally exceeded revenue growth during Newsom’s tenure in the governor’s office, creating a chronic shortfall. Despite the extra funding, the budget continues a trend of relying on reserves, shifting funds, borrowing and suspending debt payments to balance state spending.
The Legislative Analyst’s Office, the nonpartisan fiscal advisor for lawmakers, has warned of a roughly $10-billion gap between the amount of money the state brings in and spends, which could grow dramatically worse if the stock market turns downward. The LAO has said the existence of any operating deficit during a revenue boom is a red flag and that the state is “ill-prepared” for even a modest decline.
Christopher Thornberg, an economist and founder of the consulting firm Beacon Economics, said it’s business as usual in Sacramento.
“They love increasing spending. But it seems politically impossible to go the other way,” Thornberg said. “We’ve seen this play out over and over again.”
Lawmakers and the governor offered a different take and asserted that their decision to put the $6.4 billion into a short-term reserve, called the Projected Surplus Temporary Holding Account, and ask voters to allow them to store more money in the rainy day fund are examples of prudent budgeting.
“You see us save more and you see try to address the immediate needs of our community, but also the structural budget that potentially awaits us,” said Senate President Pro Tem Monique Limón (D-Goleta) in an interview. “We are forecasting a moment where we will need to address these issues and we want to start now to think about the future as well.”
Under a progressive tax structure, the state budget is dependent on income taxes paid by the ultra-rich on earnings largely from capital gains. The set up leaves California vulnerable to the unpredictable nature of the stock market, dramatic swings in revenue and, in recent years, reliant on poor projections.
Negotiations at the state Capitol included an agreement on a constitutional amendment that seeks to offset the revenue highs and lows.
If approved by voters on the statewide ballot in November, the amendment would raise a cap on mandatory deposits into the rainy day fund from 10% to 20% of general fund revenue. The measure would also allow lawmakers to exempt money they put into the rainy day fund and the temporary holding account from state spending limits.
Under an existing state appropriations restraint, also known as the Gann Limit, lawmakers cannot spend more than an amount determined by a formula that takes annual tax proceeds, changes to the population and cost of living into consideration. Tax revenue above the limit must be divided between schools and refunds to taxpayers.
With few exceptions, the limit applies to most appropriations of tax revenue, including when lawmakers put money away in the rainy day fund and other reserves.
Newsom said the change will leave the state in a much better position to weather the volatility. Though calls for tax reform remain in California, the governor said being able to place more money into the reserves could ultimately solve the state’s budget challenges.
“The one thing missing is the one thing that I think we finally landed, which is the change in the reserves,” Newsom said. “It changes the political dynamic, where now you’re not exchanging general fund priorities.”
Republicans criticized the proposed constitutional amendment, which passed in a budget trailer bill this week, for failing to require that excess revenue pays down the state’s $22 billion in unemployment insurance debt.
State Sen. Tony Strickland (R-Huntington Beach) called it a missed opportunity.
“It does not require debt payment to go to the UI debt,” Strickland said. “It facilitates more spending, exempting reserve deposits from the state spending limit.”
As part of the negotiations, lawmakers agreed to delay some healthcare cuts that would have required monthly premiums for immigrants and eliminated dental care. The deal adopts a Medi-Cal asset test of $21,000 on July 1, 2027, instead of a $2,000.
The budget agreement includes a provision requiring California’s next governor to develop options to reduce taxpayer subsidies for corporations whose employees receive state-sponsored healthcare through Medi-Cal instead of the company’s health plan. The plan is aimed at raising revenue to offset federal cuts that are expected to leave millions of Californians without access to healthcare.
The California Department of Finance said state reserves are expected to total $28.8 billion under the 2026-27 budget.
“We successfully launched as a stand-alone LTL carrier,” and “on June 1, we proudly rang the opening bell at the New York Stock Exchange, officially marking our debut as a
Seeking Alpha’s Disclaimer:This article was automatically generated by an AI tool based on content available on the Seeking Alpha website, and has not been curated or reviewed by humans. Due to inherent limitations in using AI-based tools, the accuracy, completeness, or timeliness of such articles cannot be guaranteed. This article is intended for informational purposes only. Seeking Alpha does not take account of your objectives or your financial situation and does not offer any personalized investment advice. Seeking Alpha is not a licensed securities dealer, broker or US investment adviser or investment bank.
Seeking Alpha’s Disclaimer:This article was automatically generated by an AI tool based on content available on the Seeking Alpha website, and has not been curated or reviewed by humans. Due to inherent limitations in using AI-based tools, the accuracy, completeness, or timeliness of such articles cannot be guaranteed. This article is intended for informational purposes only. Seeking Alpha does not take account of your objectives or your financial situation and does not offer any personalized investment advice. Seeking Alpha is not a licensed securities dealer, broker or US investment adviser or investment bank.
Managers and coaching staff are allowed to discuss tactics with their players while the breaks are taking place.
Infantino said: “The main reason [for the breaks] is the heat, but we also have to understand that in a competition like the World Cup, played over 39 days, with teams potentially playing eight matches in those 39 days, having a moment to rest is extremely important.
“What matters even more to us is ensuring that all teams, in every match, are playing under the same conditions.
“And it’s very difficult to accept that a coach might have the opportunity to influence a match by making adjustments simply because it is hotter, while in another match, where the temperature is slightly lower, the same coach does not have the same opportunity.
“We want to ensure equal conditions for everyone and that’s why these breaks are implemented in every match.”
Experts have told BBC Sport an average 30-second World Cup advertising slot on Fox Sports costs between $200,000 (£152,000) and $300,000 (£227,000), rising to $750,000 (£567,000) during USA matches and the final stages.
That means advertising during hydration breaks is likely to generate more than $250m (£189m) in the USA alone.
“We achieved $6.62 billion in revenue in Q2” and “non-GAAP earnings per share was $5.96,” Chairman & CEO Shantanu Narayen said, adding that “strong revenue growth was driven by subscription bookings to revenue conversion” and EPS benefited from “disciplined investments across
Seeking Alpha’s Disclaimer:This article was automatically generated by an AI tool based on content available on the Seeking Alpha website, and has not been curated or reviewed by humans. Due to inherent limitations in using AI-based tools, the accuracy, completeness, or timeliness of such articles cannot be guaranteed. This article is intended for informational purposes only. Seeking Alpha does not take account of your objectives or your financial situation and does not offer any personalized investment advice. Seeking Alpha is not a licensed securities dealer, broker or US investment adviser or investment bank.
Earnings Call Insights: Graham Corporation (GHM) Q4 fiscal 2026
Management View
“Fiscal 2026 was another year of strong execution” and delivered “record annual revenue of $245 million, record orders of $359 million, and record backlog of $533 million and a book-to-bill of 1.5x” (President, CEO & Director Matthew Malone).
Seeking Alpha’s Disclaimer:This article was automatically generated by an AI tool based on content available on the Seeking Alpha website, and has not been curated or reviewed by humans. Due to inherent limitations in using AI-based tools, the accuracy, completeness, or timeliness of such articles cannot be guaranteed. This article is intended for informational purposes only. Seeking Alpha does not take account of your objectives or your financial situation and does not offer any personalized investment advice. Seeking Alpha is not a licensed securities dealer, broker or US investment adviser or investment bank.
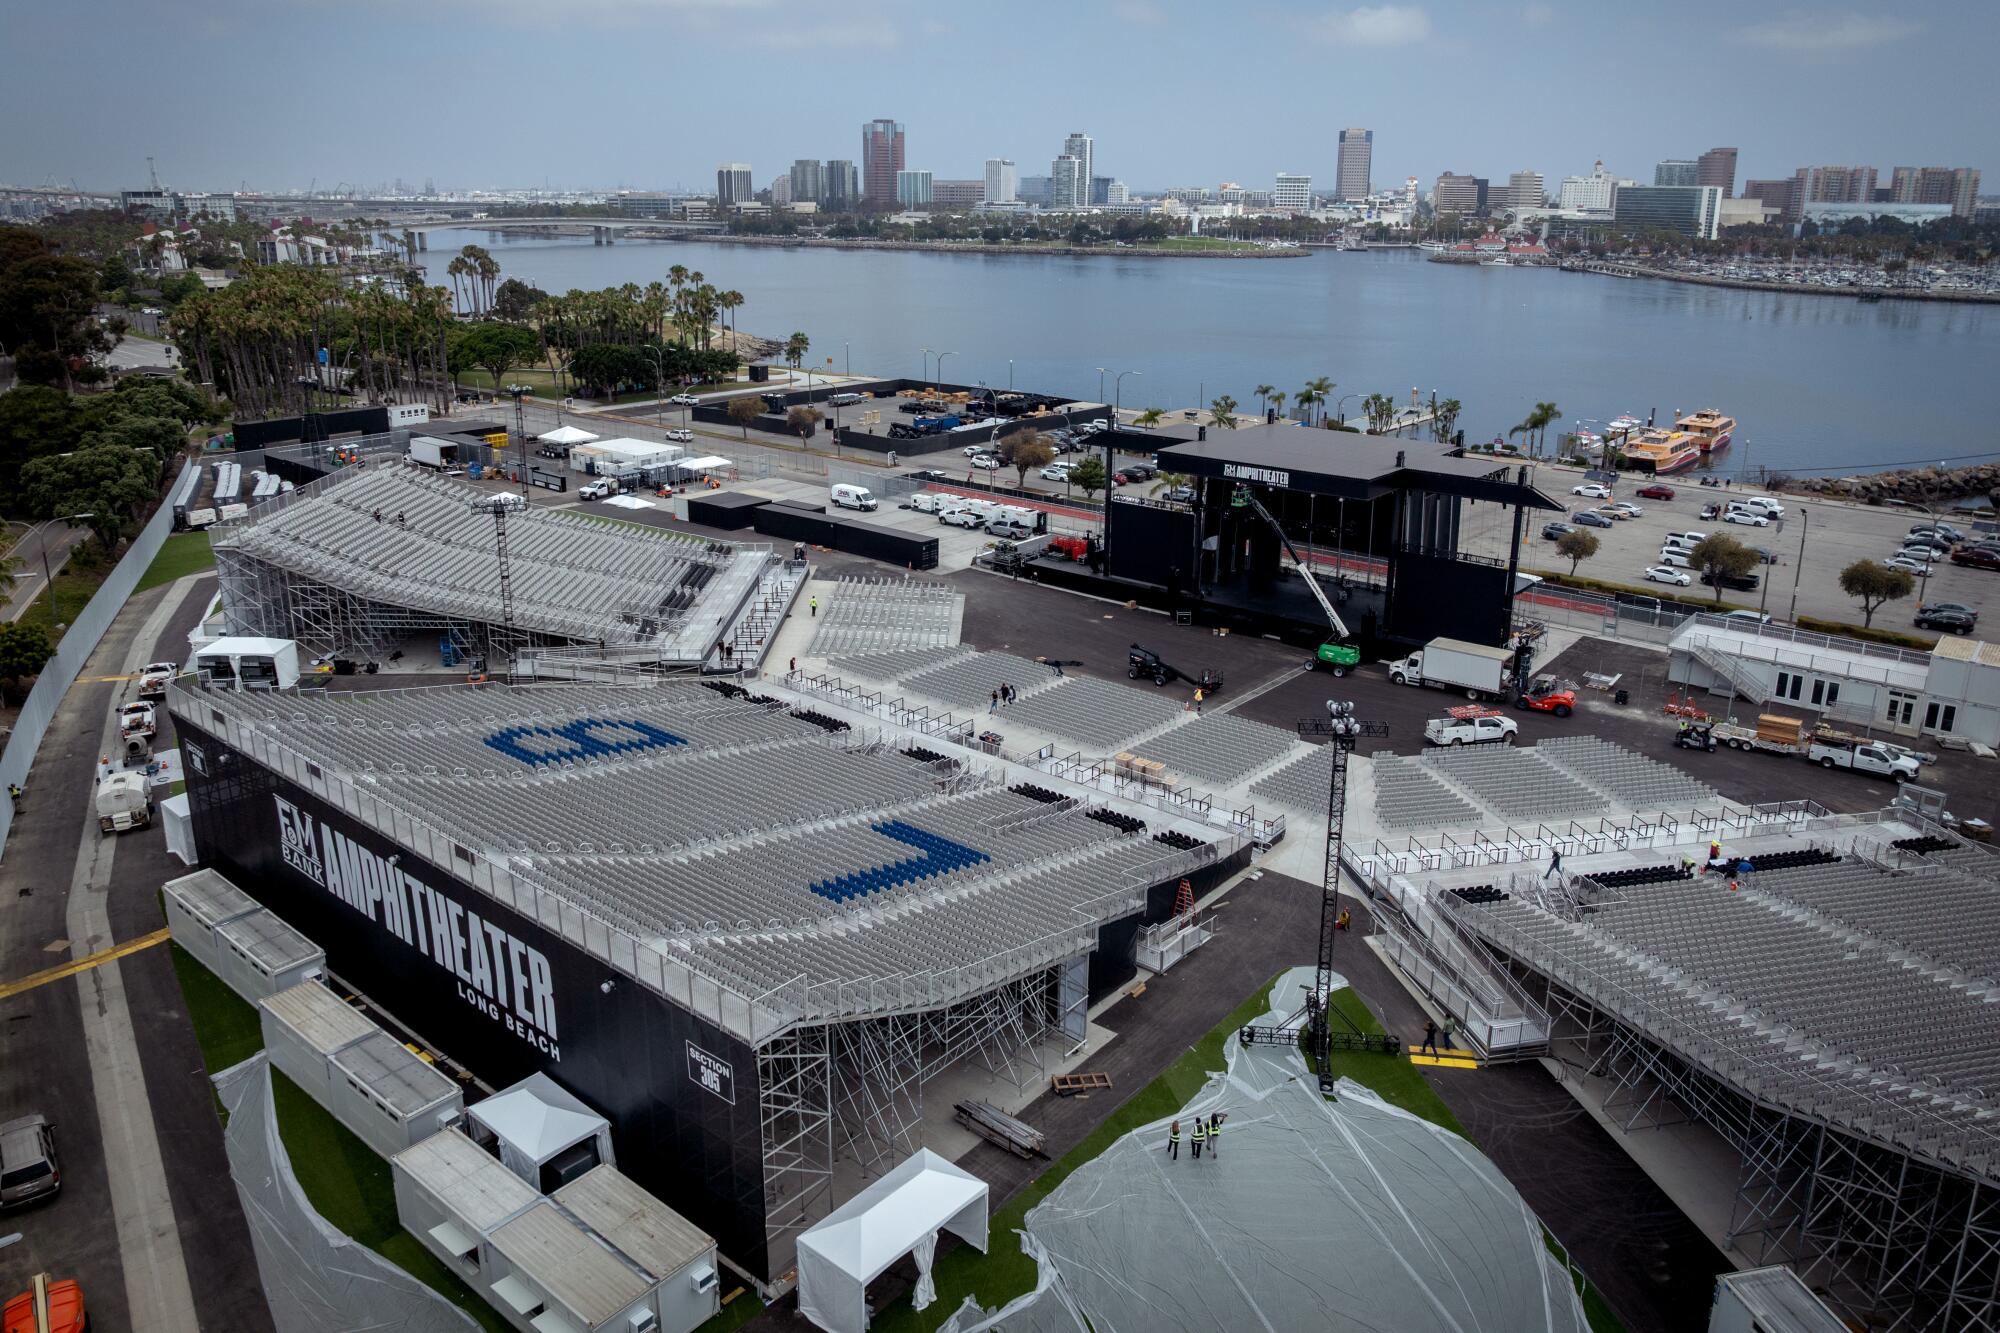
A waterfront amphitheater roughly twice the size of the Greek Theatre and two-thirds the size of the Hollywood Bowl is set to open this week in Long Beach — and there’s a lot riding on its success.
City leaders hope F&M Bank Amphitheater of Long Beach, located next to the famed Queen Mary, will supplant declining revenues from oil extraction and lead to an uptick in tourism. Concert promoters, meanwhile, see it as filling an important gap in Southern California’s music venue market.
The temporary amphitheater, which has a maximum capacity of 11,000, is meant to be a precursor to a permanent “Long Beach Bowl,” which is being pitched as the largest waterfront venue on the West Coast. The site opens June 6 with a performance by native son Snoop Dogg, and is expected to last for up to 10 years.
The new amphitheater represents a years-long dream of Mayor Rex Richardson, who began championing an outdoor performance venue on the waterfront in 2023. Soon after the closure of Irvine’s FivePoint Amphitheatre in October of that year, he accelerated those plans by proposing this facility. The general feeling was that Irvine’s loss could be Long Beach’s gain.
“This will be a place where memories are made, where music brings people together and where our city shows up on the big stage,” he said during a January groundbreaking. “The amphitheater represents direction to invest in our city’s future, to embrace our creative economy [and] to shape how people experience Long Beach for generations to come.”
Good vibes by the water is the driving energy behind the temporary venue.
(Eric Thayer / Los Angeles Times)
While Los Angeles and Orange County have no shortage of cavernous indoor arenas, the region has recently lacked a proper “summer shed” capable of hosting many national amphitheater tours, said Nick Storch, head of global artist development for booking agency Independent Artist Group. Those tours typically play venues larger than the Greek, Irvine’s Great Park Live or Costa Mesa’s fairgrounds-adjacent Pacific Amphitheatre, but smaller than the Hollywood Bowl.
Such tours, Storch said, are of “massive” importance to the concert industry. “With amphitheaters, it’s not just the music — it’s the experience of being outside and watching a concert, getting a bite to eat with your friends and all those kinds of things,” said Storch, whose agency’s clients Motley Crue and Five Finger Death Punch will perform at the F&M Bank Amphitheater in September.
“FivePoint was a great venue to help artists that are in that in-between stage, and not fully ready for arenas,” he said. “Long Beach having an amphitheater is going to grow the market again.”
Amphitheaters are also crucial to veteran artists with established fan bases. The long-running hard rock band Tesla — who also will perform at the F&M Bank Amphitheater in September — has not played a show in Los Angeles or Orange counties since the closure of FivePoint, which hosted the group twice.
Brian Wheat, the band’s bassist and manager, said he’s excited the new venue will help change that. “Sheds are great in the summertime, and outdoor summer gigs always create a great atmosphere for both bands and fans,” he said.
Much like the F&M Bank Amphitheater, FivePoint Amphitheatre was designed to serve as a temporary venue following the closure of Irvine Meadows Amphitheatre, which operated from 1981 to 2016. (From 2000 to 2014, it was known as Verizon Wireless Amphitheater.)
At 11,000 seats, the amphitheater is roughly two-thirds the size of the Hollywood Bowl. Its permanent replacement will be “architecturally iconic,” said Mayor Rex Richardson, while this temporary version is likened to a “summer shed.”
(Eric Thayer / Los Angeles Times)
From its opening in October 2017 until its closure, FivePoint hosted nearly 500 concerts, including artists such as KISS, Dave Matthews Band, Charlie Puth, Morgan Wallen and Luke Combs.
Venue operator Live Nation — which manages more than 300 facilities across the country — initially hoped to build a permanent amphitheater nearby, but scrapped those plans in 2023 after the Irvine City Council ended negotiations. Soon after, Live Nation announced the venue would shutter.
After learning of Live Nation’s fallout with Irvine, Richardson and members of his economic development team attended the final FivePoint concert, a performance by the Zac Brown Band, to “explore the feasibility if we were to do the same thing.”
Three months later, Richardson announced plans to build a temporary amphitheater in Long Beach to bridge the gap until a permanent facility — which he envisions as an “architecturally iconic and significant” waterfront venue akin to San Diego’s Rady Shell at Jacobs Park — can be permitted, financed and constructed.
The site’s location is central to its appeal, said Dan Hoffend, executive vice president of North American venues for Legends Global, the operator for F&M Bank Amphitheater. “If you sit in the very top row — what you would consider the worst seat in the house — it’s a spectacular view,” he said. “The Queen Mary is sitting there in all its glory. You’re looking across the harbor. What would be perceived as the worst seat is actually the best seat because you see it all.”
Long Beach Mayor Rex Richardson, left, and amphitheater general manager Tra Jones sit in the stands. Even from the nosebleeds, you still have a view of the waterfront at the F&M Bank Amphitheater.
(Eric Thayer / Los Angeles Times)
Tra Jones, general manager of the new amphitheater and a Long Beach native, said he’s striving to make it feel less stopgap and utilitarian than FivePoint.
“It doesn’t have a temporary feel at all,” he said. “We looked at all our surroundings and said, ‘What does this look like from a stylistic point of view?’ We leaned into the port/SteelCraft vibe — a very cool industrial look. When you walk in, you’re experiencing a vibe. That’s what we want to resonate with concertgoers coming here.”
The word “vibe” also pops up frequently in conversation with Richardson. Under his watch, Long Beach recently started branding itself as “Vibe City,” which he said is an attempt to encapsulate the charm of L.A. County’s second-largest city, and the state’s seventh-largest.
“Long Beach is special, but it’s hard to explain why if you haven’t been here,” he said. “Because you have to experience it for yourself, the best way to describe it is that it’s a vibe.”
Still, Richardson is aware that vibes can only go so far. During an April meeting with residents of downtown Long Beach, attendees were more interested in discussing homelessness and a recent uptick in traffic fatalities than how a new concert venue might add to the city’s cultural cachet. Some downtown residents have circulated a petition regarding noise-related concerns.
“The job of the mayor is to meet the needs of your residents today — keeping a roof over your head, making sure it’s safe to walk down the street, making sure you have access to amenities and services in your community — but also to think about the future,” he said.
That means finding a way to offset revenues from oil extraction, which currently finance many municipal services, and are projected to drop from more than $50 million annually to around $21 million by 2035. According to Richardson, the new amphitheater — managed by Legends Global, but owned by the city — will help cover that shortfall. The venue is projected to be profitable within five years and generate nearly $29 million in revenue by 2036.
Oil revenues, which pay for city services, are projected to drop by more than half. The amphitheater is being pitched as a budget gap solution.
(Eric Thayer / Los Angeles Times)
“We were fortunate that revenue from oil provided a lot of our services and built our beautiful waterfront, but as California moves away from oil production, we have to plan a more sustainable future by investing in what we know will be here in the long haul,” Richardson said. “In order to do that, we have to invest in arts and culture and tourism.”
Richardson is betting on music at a time when other cities — including Los Angeles — are doubling down on sports, warehousing or data centers. The amphitheater is also meant to remind the world of the city’s impact on pop culture.
From War to Warren G and Sublime to Snoop, Long Beach has a rich musical history. The city hosted the first concerts by the Beach Boys and No Doubt, while Rock & Roll Hall of Famers Elvis Presley, the Eagles and Iron Maiden all graced the stage of the Long Beach Arena.
While that venue currently holds more conventions than concerts, Long Beach has hosted notable outdoor music festivals in recent years, including Warped Tour, Day Trip and Dreamstate. Richardson believes the success of those events helped prove the city’s viability as a concert destination.
“This is the first step toward a legacy of leaving our city in a more economically resilient position,” Richardson said. “At every big turn in our city’s economy, we’ve leaned on arts as a way forward, and this is no different.”
Even the bleacher seats represent Long Beach pride at F&M Amphitheater.
“Our Q3 performance was exceptional, as we delivered a record quarter… fueled by an acceleration in organic bookings momentum, the sustained tailwinds from our platformization strategy and surging cybersecurity needs as AI
Seeking Alpha’s Disclaimer:This article was automatically generated by an AI tool based on content available on the Seeking Alpha website, and has not been curated or reviewed by humans. Due to inherent limitations in using AI-based tools, the accuracy, completeness, or timeliness of such articles cannot be guaranteed. This article is intended for informational purposes only. Seeking Alpha does not take account of your objectives or your financial situation and does not offer any personalized investment advice. Seeking Alpha is not a licensed securities dealer, broker or US investment adviser or investment bank.
Earnings Call Insights: Best Buy (BBY) Q1 fiscal 2027
Management View
“Today, we are pleased to report better-than-expected results for the first quarter” (CEO & Director Corie Barry). Barry said Q1 included “positive comps across the majority of our major product categories” and that the company “also drove
Seeking Alpha’s Disclaimer:This article was automatically generated by an AI tool based on content available on the Seeking Alpha website, and has not been curated or reviewed by humans. Due to inherent limitations in using AI-based tools, the accuracy, completeness, or timeliness of such articles cannot be guaranteed. This article is intended for informational purposes only. Seeking Alpha does not take account of your objectives or your financial situation and does not offer any personalized investment advice. Seeking Alpha is not a licensed securities dealer, broker or US investment adviser or investment bank.
Spotify Technology SA announced several new initiatives — from concert ticket perks to a major AI-generated music licensing deal — that the Swedish audio streaming company said will help fuel growth over the next four years.
At the first investor day led by new co-chief executives Gustav Söderström and Alex Norström, Spotify outlined a vision revolving around features that will allow people to personalize their listening experience, whether with music, podcasts, audiobooks or working out. Investors liked what they heard, pushing Spotify shares up as much as 18% over the course of the presentation.
Spotify addressed one of Wall Street’s biggest concerns about artificial intelligence by announcing a major new licensing deal with Universal Music Group NV. The agreement will let Spotify launch a tool to let fans create covers and remixes of their favorite songs from artists and songwriters who opt in. Powered by generative AI, the tool will be available as a paid add-on for Spotify Premium users. It will open up additional revenue streams for Spotify and create a new source of income for artists and songwriters on top of what they already earn on the platform, according to the companies.
Spotify has been working with the music industry on ways to harness the power and consumer interest in AI without violating artists’ rights. Last October, the company announced an agreement with the biggest record labels to use AI in a “responsible way,” but didn’t specify at the time what those tools would look like.
“This era of generation doesn’t need to threaten the future of music,” said Charlie Hellman, Spotify’s head of music. “Because we built the system legal, trusted and aligned, we can make sure that the value flows back to the people who created it.”
In another big announcement, the company laid out plans to work with Live Nation Entertainment Inc. to offer Spotify subscribers the option to purchase two tickets to their favorite star’s concert before they go on sale to the general public. The move could help resolve some of the issues fans have had in beating ticket resellers to face-value tickets, while encouraging customers to stay on as subscribers even as Spotify raises monthly fees.
Fans have long complained about the ticketing process for live performances, which often pit people against bots and scalpers, leading to high prices and sold-out shows.
“It’s frustrating for fans,” said Rene Volker, head of live events. “It’s frustrating for artists too, who look out at a crowd and wonder, are the fans who built my career actually here?” The new “Reserved” perk is designed to relieve some of that tension. “No racing bots, no chasing around online for presale codes. Just two tickets held for you,” she said.
The presentations Thursday were designed to comfort investors and prove that Spotify can still innovate. Wall Street has been skeptical that the company can rein in costs while staying ahead of competitors, particularly as it relates to AI. Those concerns have weighed on shares this year, sending them down 25% through Wednesday’s close. While the company makes most of its money through subscriptions, the executives sought to reinforce the idea that they have other levers to pull in order to generate sales beyond monthly fees and that people are willing to spend more for certain features.
The company outlined its growth targets through 2030, including a compound annual growth rate in the mid teens, a gross margin of 35% to 40% and an operating margin above 20%. Spotify remains committed to its long-term goal of 1 billion subscribers, $100 billion in revenue and over 40% in gross margin, the executives said.
Spotify sees its podcast and audiobook features as complementary to music and said the combination of the multiple verticals has helped broaden its community and convert users from free listeners to paid subscribers. Today, more than 500 million people have streamed a video podcast on Spotify, up nearly 50% from a year ago. And in just a few years, Spotify has captured about 20% of the audiobooks market in the US, executives said. People who use all three verticals — music, podcasts and audiobooks — are engaging with Spotify almost every day of the month, according to the company.
Giving people the tools to personalize their listening experience helps keep them in Spotify’s universe — creating what executives described as the “all day user.”
Personal Podcasts, for example, lets people write a prompt in the Spotify app and AI will create a unique podcast in response.
“We see this much more as a daily brief and a recommendation engine than something that would replace you listening to one of your favorite podcasts,” Söderström said in an interview. He noted that 60% of users in mature markets for Spotify don’t yet listen to podcasts, so features like Personal Podcasts could get them to dive into the medium.
The company said its podcast business has been profitable for two years.
Spotify’s Audiobook+ tier gives listeners more than their allotted 15 hours of audiobook listening per month for an additional fee. It has 1 million subscribers and is on track to generate $100 million in annualized revenue, the company said. To capitalize on the demand, Spotify will start selling even more audiobook hours to super users. Additionally, it will allow podcasters to offer memberships, so subscribers can access special episodes and other content. Spotify will take an undisclosed slice of revenue from the memberships.
“This was an extraordinary quarter, demand has gone parabolic. The reason is simple, agentic AI has arrived. AI can now do productive and valuable work. Tokens are now profitable, so model makers are in a race
Seeking Alpha’s Disclaimer:This article was automatically generated by an AI tool based on content available on the Seeking Alpha website, and has not been curated or reviewed by humans. Due to inherent limitations in using AI-based tools, the accuracy, completeness, or timeliness of such articles cannot be guaranteed. This article is intended for informational purposes only. Seeking Alpha does not take account of your objectives or your financial situation and does not offer any personalized investment advice. Seeking Alpha is not a licensed securities dealer, broker or US investment adviser or investment bank.
“We delivered strong overall results this quarter with Q3 revenue growing 10% as we made significant progress executing on our AI-driven expert platform strategy.” (CEO, President & Chairman Sasan Goodarzi)
Seeking Alpha’s Disclaimer:This article was automatically generated by an AI tool based on content available on the Seeking Alpha website, and has not been curated or reviewed by humans. Due to inherent limitations in using AI-based tools, the accuracy, completeness, or timeliness of such articles cannot be guaranteed. This article is intended for informational purposes only. Seeking Alpha does not take account of your objectives or your financial situation and does not offer any personalized investment advice. Seeking Alpha is not a licensed securities dealer, broker or US investment adviser or investment bank.
Earnings Call Insights: Agilysys, Inc. (AGYS) Q4 fiscal 2026
Management View
“Fiscal 2026 Q4 was an excellent overall business quarter for Agilysys, including with respect to sales, revenue and profitability, each of which set a new quarter record.” (CEO, President & Director Ramesh Srinivasan)
Seeking Alpha’s Disclaimer:This article was automatically generated by an AI tool based on content available on the Seeking Alpha website, and has not been curated or reviewed by humans. Due to inherent limitations in using AI-based tools, the accuracy, completeness, or timeliness of such articles cannot be guaranteed. This article is intended for informational purposes only. Seeking Alpha does not take account of your objectives or your financial situation and does not offer any personalized investment advice. Seeking Alpha is not a licensed securities dealer, broker or US investment adviser or investment bank.
Earnings Call Insights: United States Antimony Corporation (UAMY) Q1 2026
Management View
CEO Gary Evans said, “This is no longer just an antimony company” and pointed investors to a portfolio spanning “antimony, cobalt, gold, tungsten, and zeolite,” alongside ramping processing capacity and government-linked demand.
Seeking Alpha’s Disclaimer:This article was automatically generated by an AI tool based on content available on the Seeking Alpha website, and has not been curated or reviewed by humans. Due to inherent limitations in using AI-based tools, the accuracy, completeness, or timeliness of such articles cannot be guaranteed. This article is intended for informational purposes only. Seeking Alpha does not take account of your objectives or your financial situation and does not offer any personalized investment advice. Seeking Alpha is not a licensed securities dealer, broker or US investment adviser or investment bank.
SACRAMENTO — Hours before Gov. Gavin Newsom is expected to present his budget plan on Thursday, his office released new projections of a $16.5-billion state revenue windfall over three years and offered a rosy outlook on California’s fiscal position during his final year in office and the year after.
Newsom’s office provided few details about his plan to reduce spending or other adjustments that he would need to propose in combination with the increase in revenue to eliminate projected deficits from 2026-27 through 2027-28.
The unusual early look at his budget proposal comes as Newsom begins to wind down his time at the state Capitol and considers a run for president in 2028.
Two weeks ago, the Legislative Analyst’s Office issued an analysis of state spending that said California could not, in the long term, afford to pay for existing services and the new programs that Newsom and Democratic lawmakers have enacted since he took office in 2019. State spending has outpaced California’s strong revenue growth by about 10%, creating a perennial budget shortfall, defined as a structural deficit.
California’s spending problem threatens to define Newsom’s fiscal legacy and could provide ripe fodder for his critics. If projections of the unexpected tax windfall, which analysts attribute to stock market interest in artificial intelligence companies, bear out, the upswing could mark a lucky break for Newsom.
The governor has largely resisted adopting new across-the-board tax increases or sharply curtailing his expensive policy proposals in order to align state spending with revenue.
His budget proposal includes a call to increase taxes on corporations by limiting state tax credits to no more than $5 million, or 50% of a company’s tax liability, beginning in the tax year 2027. No estimates were offered to explain how much revenue the new cap would bring in to support the state budget.
The preview of his budget has several new spending proposals, including providing $300 million to help low-income Californians keep $0 monthly premiums on healthcare coverage through the Affordable Care Act in response to cuts by the federal government, as well as $100 million to help wildfire victims afford construction loans to rebuild their homes. Two days before Mother’s Day, Newsom also introduced a plan to provide 400 free diapers for every California newborn at select hospitals beginning this summer.
Newsom is expected to present his budget in more detail late Thursday morning in Sacramento.