


Two Dragons’ Den entrepreneurs were branded “delusional” by Touker Suleyman over their valuation after he turned down their pitch, but their vegan pet food brand is now worth £11,000,000.

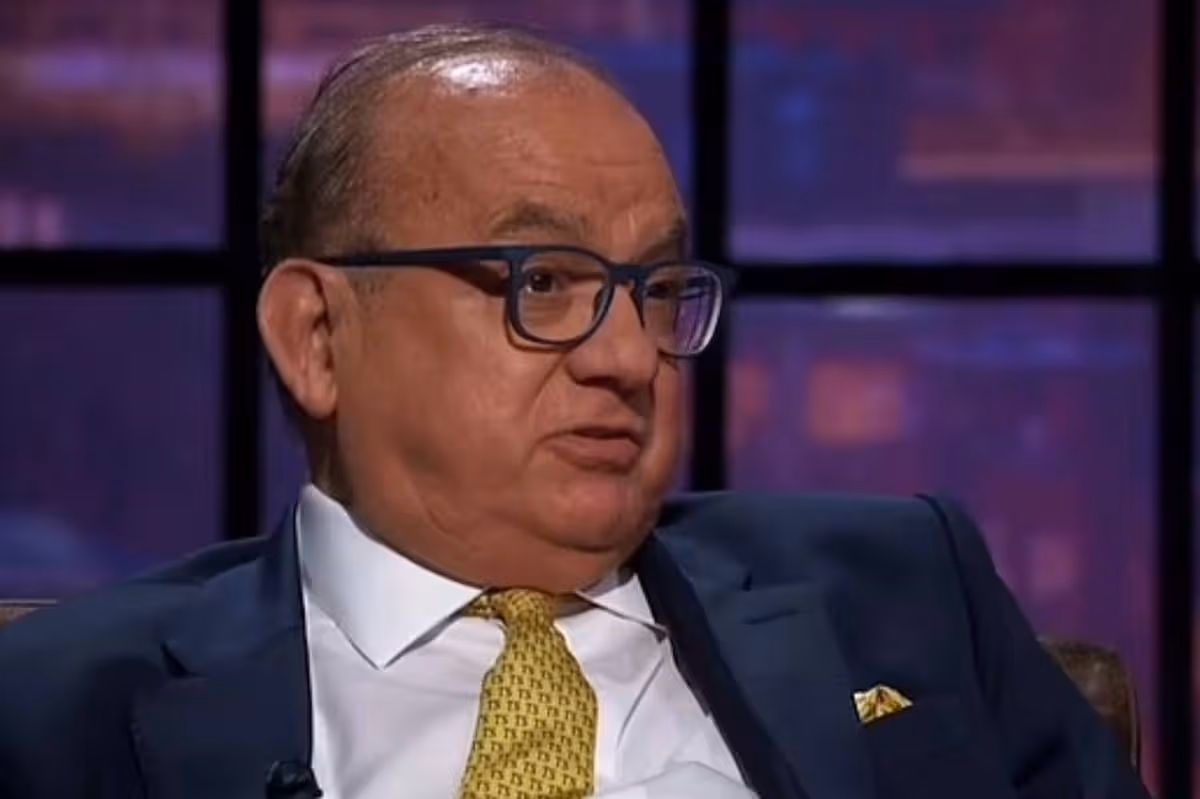
Touker Suleyman has stepped down from Dragons’ Den(Image: BBC)
Dragons’ Den stars who Touker Suleyman once labelled “delusional” have revealed their company is now turning over £11,000,000.
The Dragon confirmed at the weekend that he would be departing the show after “ten extraordinary years”.
In a social media post, Touker shared: “It has been an immense privilege to sit in that chair, to meet so many passionate and talented entrepreneurs, and to invest in businesses and people I truly believed in.
“The show gave me a platform not only to invest in leading British founders and companies, but to share hard-won wisdom built over decades in business – and I hope that, in some small way, I made a difference to those who stood opposite me.”
Yet one particular pair of entrepreneurs who faced Touker in the Den were on the receiving end of some scathing criticism from the businessman, reports Wales Online.
Omni founders Dr Guy Sandelowsky and Shiv Sivakumar appeared on the programme last year, seeking investment in their protein-based, vegan pet food brand.
Established in 2021, their brand centred on improving pets’ wellbeing through lab-grown food that was calorie-controlled and environmentally sustainable, while also delivering on taste.
Within two years, they had racked up over £2,500,000 in sales, and were seeking £75,000 from the Dragons in exchange for a 1% stake in their business.
Touker, however, remained wholly unimpressed, declaring he “wouldn’t even get out of bed for” that sum, and bluntly stated: “You’re delusional about what this is really worth.”
Although Deborah Meaden and Steven Bartlett championed the entrepreneurs, Touker rejected Omni’s lifetime value projections, and was swift to utter the infamous words, “I’m out.”
Yet, despite his scathing assessment, the Omni entrepreneurs disclosed in a 2025 interview that their business was valued at £7,500,000, and shortly afterwards, they’d soared to £11,000,000, even collaborating with Springwatch’s Chris Packham.
Reflecting on Touker and also Peter Jones’ brutal comments in the Den, Dr Guy and Shiv previously told Metro: “I feel like when we were in the Den, they were looking at our historical numbers and basing that on our valuation, but what we were basing it on was actually what our revenue was like at that point, because we’re so fast-growing.”
Dr Guy went on: “We can make quite reasonable assumptions about what we’re going to do in the coming months as well, and I felt like that wasn’t necessarily as much their focus. When you look at our run-rate based on our revenue, it’s not as crazy as they were sort of alluding to at all.”
He continued by stressing that their experience in the Den came down to their product, not their numbers.
He added: “In hindsight, the one disadvantage of it is that we didn’t get to show the nation so much of the other stuff we filmed, like the details of our products.”
Speaking back in March 2025, they said the response from the series had been “amazing”, adding: “We’re trying to keep up, honestly, we’re just a small business trying to help pets live happier lives, and we knew that going on the show would increase our exposure.
“But we never imagined the demand that we’re seeing now, we’ve had to re-evaluate our stock levels and the number of people helping with our customer service and packaging, so it’s been really, really positive.”
He went on: “It’s just a testament to the fact that so many people out there watching the show understood what we’re trying to do, aligned with our mission and were willing to give it a go.”
Sharing his announcement that he was stepping down from Dragons’ Den this weekend, Touker’s statement went on: “Stepping back from Dragons’ will give me more time to mentor the entrepreneurs I have invested in, and to give back the 50 years of business experience I have accumulated.
“If I can help the next generation avoid the pitfalls I’ve faced, seize the opportunities I almost missed, and build businesses they are truly proud of, then that will be the most rewarding chapter of my career yet.”
Touker concluded: “To the BBC, to my fellow Dragons past and present, to the production team, and above all to the entrepreneurs who dared to walk through those doors – thank you.
“It has been one of the greatest joys of my career. The fire in the Den burns on. I simply pass the torch.”
After Sara Davies’ departure last year, it has yet to be confirmed who will be joining Deborah Meaden, Peter Jones and Steven Bartlett in the Den.
Dragons’ Den is available to watch on BBC iPlayer.