Donald Trump’s complete convention speech, annotated
Times journalists are annotating this speech. If you see a passage highlighted in yellow, you can click on it to see what we have to say about it. You can also highlight passages and leave your own comments.
Friends, delegates and fellow Americans: I humbly and gratefully accept your nomination for the presidency of the United States.
U-S-A! U-S-A! U-S-A! U-S-A! Who would’ve believed that when we started this journey on June 16, last year, we and I say we, because we are a team, would have received almost 14 million votes, the most in the history of the Republican Party, and that the Republican Party would get 60% more votes than it received eight years ago. Who would’ve believed this? Who would’ve believed this? The Democrats on the other hand, received 20% fewer votes than they got four years ago, not so good, not so good.
Together, we will lead our party back to the White House, and we will lead our country back to safety, prosperity and peace. We will be a country of generosity and warmth. But we will also be a country of law and order.
Our convention occurs at a moment of crisis for our nation. The attacks on our police, and the terrorism in our cities, threaten our very way of life. Any politician who does not grasp this danger is not fit to lead our country.
Americans watching this address tonight have seen the recent images of violence in our streets and the chaos in our communities. Many have witnessed this violence personally, some have even been its victims.
I have a message for all of you: The crime and violence that today afflicts our nation will soon, and I mean very soon, come to an end. Beginning on January 20th, 2017, safety will be restored.
The most basic duty of government is to defend the lives of its own citizens. Any government that fails to do so is a government unworthy to lead.
It is finally time for a straightforward assessment of the state of our nation.
I will present the facts plainly and honestly. We cannot afford to be so politically correct anymore. So if you want to hear the corporate spin, the carefully crafted lies and the media myths, the Democrats are holding their convention next week. Go there.
But here, at our convention, there will be no lies. We will honor the American people with the truth, and nothing else.
These are the facts:
Decades of progress made in bringing down crime are now being reversed by this administration’s rollback of criminal enforcement.
Homicides last year increased by 17% in America’s 50 largest cities. That’s the largest increase in 25 years. In our nation’s capital, killings have risen by 50%. They’re up nearly 60% in nearby Baltimore.
In the president’s hometown of Chicago, more than 2,000 people have been the victim of shootings this year alone. And almost 4,000 have been killed in the Chicago area since he took office.
The number of police officers killed in the line of duty has risen by almost 50% compared to this point last year. Nearly 180,000 illegal immigrants with criminal records, ordered deported from our country, are tonight roaming free to threaten peaceful citizens.
The number of new illegal immigrant families who have crossed the border so far this year already exceeds the entire total from 2015. They are being released by the tens of thousands into our communities with no regard for the impact on public safety or resources.
One such border-crosser was released and made his way to Nebraska. There, he ended the life of an innocent young girl named Sarah Root. She was 21 years old and was killed the day after graduating from college with a 4.0 grade point average, No. 1 in her class. Her killer was then released a second time, and he is now a fugitive from the law.
I’ve met Sarah’s beautiful family. But to this administration, their amazing daughter was just one more American life that wasn’t worth protecting. No more. One more child to sacrifice on the altar of open borders.
What about our economy? Again, I will tell you the plain facts that have been edited out of your nightly news and your morning newspaper: Nearly 4 in 10 African American children are living in poverty, while 58% of African American youth are now not employed. Two million more Latinos are in poverty today than when President Obama took his oath of office less than eight years ago. Another 14 million people have left the workforce entirely.
Household incomes are down more than $4,000 since the year 2000. That’s 16 years ago. Our manufacturing trade deficit has reached an all-time high. Think of this, think of this: Our trade deficit is nearly $800 billion last year alone. We’re gonna fix that.
The budget is no better. President Obama has almost doubled our national debt to more than $19 trillion, and growing. And yet, what do we have to show for it? Our roads and bridges are falling apart, our airports are Third World condition, and 43 million Americans are on food stamps.
Now let us consider the state of affairs abroad.
Not only have our citizens endured domestic disaster, but they’ve lived through one international humiliation after another. One after another. We all remember the images of our sailors being forced to their knees by their Iranian captors at gunpoint.
This was just prior to the signing of the Iran deal, which gave back to Iran $150 billion and gave us absolutely nothing. It will go down in history as one of the worst deals ever negotiated. Another humiliation came when President Obama drew a red line in Syria – and the whole world knew it meant absolutely nothing.
In Libya, our consulate – the symbol of American prestige around the globe – was brought down in flames. America is far less safe – and the world is far less stable – than when Obama made the decision to put Hillary Clinton in charge of America’s foreign policy. Let’s defeat her in November.
I am certain it is a decision President Obama truly regrets. Her bad instincts and her bad judgment – something pointed out by Bernie Sanders – are what caused the disasters unfolding today. Let’s review the record. In 2009, pre-Hillary, ISIS was not even on the map.
Libya was stable. Egypt was peaceful. Iraq was seeing and really a big, big reduction in violence. Iran was being choked by sanctions. Syria was somewhat under control. After four years of Hillary Clinton, what do we have?
ISIS has spread across the region, and the entire world. Libya is in ruins, and our ambassador and his staff were left helpless to die at the hands of savage killers. Egypt was turned over to the radical Muslim brotherhood, forcing the military to retake control. Iraq is in chaos.
Iran is on the path to nuclear weapons. Syria is engulfed in a civil war, and a refugee crisis now threatens the West. After 15 years of wars in the Middle East, after trillions of dollars spent and thousands of lives lost, the situation is worse than it has ever been before.
This is the legacy of Hillary Clinton: death, destruction, terrorism and weakness.
But Hillary Clinton’s legacy does not have to be America’s legacy. The problems we face now – poverty and violence at home, war and destruction abroad – will last only as long as we continue relying on the same politicians who created them in the first place. A change in leadership is required to produce a change in outcomes. Tonight, I will share with you my plan for action for America.
The most important difference between our plan and that of our opponent, is that our plan will put America first. Americanism, not globalism, will be our credo. As long as we are led by politicians who will not put America first, then we can be assured that other nations will not treat America with respect. The respect that we deserve.
The American people will come first once again. My plan will begin with safety at home – which means safe neighborhoods, secure borders and protection from terrorism. There can be no prosperity without law and order. On the economy, I will outline reforms to add millions of new jobs and trillions in new wealth that can be used to rebuild America.
A number of these reforms that I will outline tonight will be opposed by some of our nation’s most powerful special interests. That’s because these interests have rigged our political and economic system for their exclusive benefit. Believe me, it’s for their benefit.
Big business, elite media and major donors are lining up behind the campaign of my opponent because they know she will keep our rigged system in place. They are throwing money at her because they have total control over every single thing she does. She is their puppet, and they pull the strings.
That is why Hillary Clinton’s message is that things will never change. Never ever. My message is that things have to change – and they have to change right now. Every day I wake up determined to deliver a better life for the people all across this nation that have been neglected, ignored and abandoned.

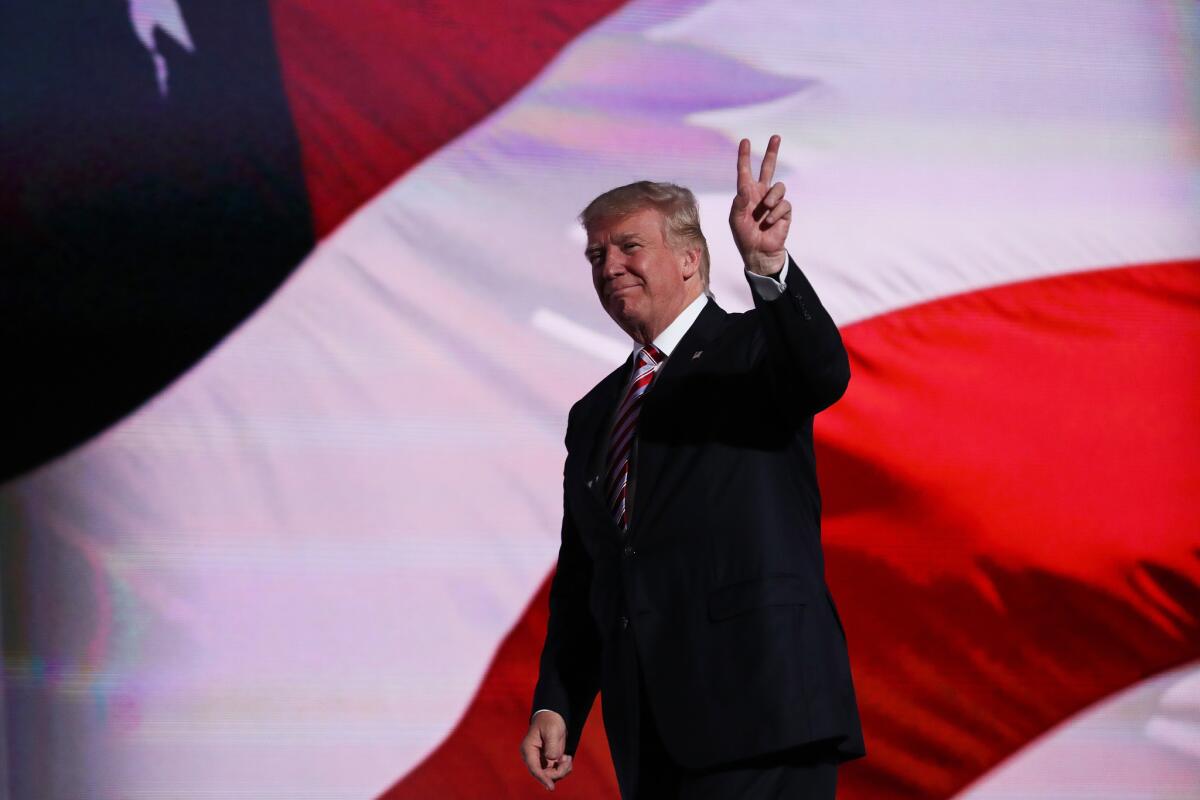
(John Moore/Getty Images)
(John Moore / Getty Images)
I have visited the laid-off factory workers and the communities crushed by our horrible and unfair trade deals. These are the forgotten men and women of our country. And they are forgotten, but they’re not gonna be forgotten long.
These are people who work hard but no longer have a voice. I am your voice.
I have embraced crying mothers who have lost their children because our politicians put their personal agendas before the national good. I have no patience for injustice.
How great are our police, and how great is Cleveland? Thank you.
I have no patience for injustice, no tolerance for government incompetence, of which there is so much, no sympathy for leaders who fail their citizens.
When innocent people suffer, because our political system lacks the will or the courage or the basic decency to enforce our laws – or worse still, has sold out to some corporate lobbyist for cash – I am not able to look the other way.
And when a secretary of State illegally stores her emails on a private server, deletes 33,000 of them so the authorities can’t see her crime, puts our country at risk, lies about it in every different form and faces no consequence – I know that corruption has reached a level like never ever before in our country.
When the FBI director says that the secretary of State was “extremely careless” and “negligent” in handling our classified secrets, I also know that these terms are minor compared to what she actually did. They were just used to save her from facing justice for her terrible, terrible crimes.
In fact, her single greatest accomplishment may be committing such an egregious crime and getting away with it – especially when others who have done far less have paid so dearly. When that same secretary of State rakes in millions of dollars trading access and favors to special interests and foreign powers, I know the time for action has come.
I have joined the political arena so that the powerful can no longer beat up on people who cannot defend themselves. Nobody knows the system better than me, which is why I alone can fix it. I have seen firsthand how the system is rigged against our citizens, just like it was rigged against Bernie Sanders – he never had a chance.
But his supporters will join our movement, because we will fix his biggest issue: trade deals that strip our country of its jobs and strip us of our wealth as a country. Millions of Democrats will join our movement too because we are going to fix the system so it works fairly and justly for each and every American. In this cause, I am proud to have at my side the next vice president of the United States: Gov. Mike Pence of Indiana. And a great guy.
We will bring the same economic success to America that Mike brought to Indiana. Which is amazing. He is a man of character and accomplishment. He is the man for the job. The first task for our new administration will be to liberate our citizens from the crime and terrorism and lawlessness that threatens our communities.
America was shocked to its core when our police officers in Dallas were so brutally executed. Immediately after Dallas, we have seen continued threats and violence against our law enforcement officials. Law officers have been shot or killed in recent days in Georgia, Missouri, Wisconsin, Kansas, Michigan and Tennessee.
On Sunday, more police were gunned down in Baton Rouge, Louisiana. Three were killed, and three were very, very badly injured. An attack on law enforcement is an attack on all Americans. I have a message to every last person threatening the peace on our streets and the safety of our police: When I take the oath of office next year, I will restore law and order to our country. Believe me, believe me.
I will work with, and appoint, the best and brightest prosecutors and law enforcement officials in the country to get the job properly done. In this race for the White House, I am the law-and-order candidate. The irresponsible rhetoric of our president, who has used the pulpit of the presidency to divide us by race and color, has made America a more dangerous environment than frankly I have ever seen and anybody in this room has ever watched or seen.
This administration has failed America’s inner cities. It’s failed them on education. It’s failed them on jobs. It’s failed them in crime. It’s failed them in every way and on every single level.
When I am president, I will work to ensure that all of our kids are treated equally and protected equally.
SIGN UP for our free Essential Politics newsletter »
Every action I take, I will ask myself: Does this make better for young Americans in Baltimore, in Chicago, in Detroit, in Ferguson who really in every way have as much of a right to live out their dreams as any other child in America? As any other child?
To make life safe for all of our citizens, we must also address the growing threats we face from outside America. We are going to defeat the barbarians of ISIS and we’re going to defeat them fast. Once again, France is the victim of brutal Islamic terrorism.
Men, women and children viciously mowed down. Lives ruined. Families ripped apart. A nation in mourning.
The damage and devastation that can be inflicted by Islamic radicals has been proven over and over – at the World Trade Center, at an office party in San Bernardino, at the Boston Marathon and a military recruiting center in Chattanooga, Tennessee, and many, many other locations.
Only weeks ago, in Orlando, Florida, 49 wonderful Americans were savagely murdered by an Islamic terrorist. This time, the terrorist targeted LGBTQ community. No good, and we’re gonna stop it. As your president, I will do everything in my power to protect our LGBTQ citizens from the violence and oppression of a hateful foreign ideology. Believe me.
And I have to say, as a Republican, it is so nice to hear you cheering for what I just said. Thank you.
To protect us from terrorism, we need to focus on three things.
We must have the best, absolutely the best gathering of intelligence anywhere in the world. The best. We must abandon the failed policy of nation building and regime change that Hillary Clinton pushed in Iraq, Libya, Egypt and in Syria. Instead, we must work with all of our allies who share our goal of destroying ISIS and stamping out Islamic terrorism and doing it now, doing it quickly, we’re going to win, we’re going to win fast.
This includes working with our greatest ally in the region, the state of Israel.
Recently, I have said that NATO was obsolete. Because it did not properly cover terrorism. And also, that many of the member countries were not paying their fair share. As usual, the United States has been picking up the cost. Shortly thereafter, it was announced that NATO will be setting up a new program in order to combat terrorism. A true step in the right direction.
Lastly, and very importantly, we must immediately suspend immigration from any nation that has been compromised by terrorism until such time as proven vetting mechanisms have been put in place. We don’t want them in our country.
My opponent has called for a radical 550% increase in Syrian — think of this, think of this, this is not believable but this is what’s happening — a 550% increase in Syrian refugees on top of existing massive refugee flows coming into our country already under the leadership of President Obama. She proposes this despite the fact that there’s no way to screen these refugees in order to find out who they are or where they come from. I only want to admit individuals into our country who will support our values and love our people.
Anyone who endorses violence, hatred or oppression is not welcome in our country and never ever will be.
Decades of record immigration have produced lower wages and higher unemployment for our citizens, especially for African American and Latino workers. We are going to have an immigration system that works, but one that works for the American people.
On Monday, we heard from three parents whose children were killed by illegal immigrants. Mary Ann Mendoza, Sabine Durden and my friend Jamiel Shaw. They’re just three brave representatives of many thousands who have suffered so gravely. Of all my travels in this country, nothing has affected me more, nothing even close I have to tell you, than the time I have spent with the mothers and fathers who have lost their children to violence spilling across our borders. Which we can solve. We have to solve it.
These families have no special interests to represent them. There are no demonstrators to protect them and certainly none to protest on their behalf. My opponent will never meet with them, or share in their pain, believe me. Instead, my opponent wants sanctuary cities. But where was the sanctuary for Kate Steinle? Where was sanctuary for the children of Mary Ann and Sabine and Jamiel? Where was sanctuary for all of, aw, it’s so sad to even be talking about it, because we can solve it so quickly. Where was the sanctuary for the other Americans who have been so brutally murdered and who have suffered so horribly?
These wounded American families have been alone. But they are not alone any longer. Tonight, this candidate and the whole nation stand in their corner to support them, to send them our love and to pledge in their honor that we will save countless more families from suffering and the same awful fate.
We are going to build a great border wall to stop illegal immigration, to stop the gangs and the violence, and to stop the drugs from pouring into our communities. I have been honored to receive the endorsement of America’s border patrol agents, and will work directly with them to protect the integrity of our lawful, lawful, lawful immigration system. Lawful.
By ending catch-and-release on the border, we will end the cycle of human smuggling and violence. Illegal border crossings will go down. We will stop it. It won’t be happening very much any more, believe me. Peace will be restored. By enforcing the rules for millions who overstay their visas, our laws will finally receive the respect that they deserve.
Tonight, I want every American whose demands for immigration security have been denied – and every politician who has denied them – to listen very, very closely to the words I am about to say.
On January 20th of 2017, the day I take the oath of office, Americans will finally wake up in a country where the laws of the United States are enforced. We are going to be considerate and compassionate to everyone.
But my greatest compassion will be for our own struggling citizens. USA, USA, USA. My plan is the exact opposite of the radical and dangerous immigration policy of Hillary Clinton. Americans want relief from uncontrolled immigration. Which is what we have now. Communities want relief.
Yet Hillary Clinton is proposing mass amnesty, mass immigration and mass lawlessness. Her plan will overwhelm your schools and hospitals, further reduce your jobs and wages, and make it harder for recent immigrants to escape the tremendous cycle of from poverty that they’re going through right now, and make it almost impossible for them to join the middle class.
I have a different vision for our workers. It begins with a new, fair trade policy that protects our jobs and stands up to countries that cheat, of which there are many. It’s been a signature message of my campaign from Day One, and it will be a signature feature of my presidency from the moment I take the oath of office.
I have made billions of dollars in business making deals – now I’m going to make our country rich again. Using the greatest business people in the world, which our country has, I am going to turn our bad trade agreements into great trade agreements. America has lost nearly one-third of its manufacturing jobs since 1997, following the enactment of disastrous trade deals supported by Bill and Hillary Clinton.
Remember, it was Bill Clinton who signed NAFTA, one of the worst economic deals ever made by our country or frankly any other country.
Never ever again.
I am going to bring our jobs to Ohio and Pennsylvania and New York and Michigan and all of America – and I am not going to let companies move to other countries, firing their employees along the way, without consequence. Not gonna happen anymore.
My opponent, on the other hand, has supported virtually every trade agreement that has been destroying our middle class. She supported NAFTA, and she supported China’s entrance into the World Trade Organization – another one of her husband’s colossal mistakes and disasters.
She supported the job-killing trade deal with South Korea. She supported the Trans-Pacific Partnership, which will not only destroy our manufacturing, but it will make America subject to the rulings of foreign governments. And it’s not going to happen. I pledge to never sign any trade agreement that hurts our workers, or that diminishes our freedom or our independence. We will never, ever sign these trade deals. America first again. America first.
Instead, I will make individual deals with individual countries.

(Carolyn Cole / Los Angeles Times)
No longer will we enter into these massive transactions, with many countries, that are thousands of pages long – and which no one from our country even reads or understands. We are going to enforce all trade violations against any country that cheats.
This includes stopping China’s outrageous theft of intellectual property, along with their illegal product dumping, and their devastating currency manipulation. They are the greatest that ever came about, they are the greatest currency manipulators ever.
Our horrible trade agreements with China and many others will be totally renegotiated. That includes renegotiating NAFTA to get a much better deal for America – and we’ll walk away if we don’t get that kind of a deal. Our country is going to start building and making things again.
Next comes the reform of our tax laws, regulations and energy rules. While Hillary Clinton plans a massive, and I mean massive, tax increase, I have proposed the largest tax reduction of any candidate who has run for president this year – Democrat or Republican. Middle-income Americans and businesses will experience profound relief, and taxes will be greatly simplified for everyone. And I mean everyone.
America is one of the highest-taxed nations in the world. Reducing taxes will cause new companies and new jobs to come roaring back into our country. Believe me, it’ll happen and it’ll happen fast. Then we are going to deal with the issue of regulation, one of the greatest job-killers of them all. Excessive regulation is costing our country as much as $2 trillion a year, and we will end it very, very quickly. We are going to lift the restrictions on the production of American energy. This will produce more than $20 trillion in job creating economic activity over the next four decades.

(Brian van der Brug / Los Angeles Times)
(TIMOTHY A. CLARY / AFP/Getty Images)
My opponent, on the other hand, wants to put the great miners and the great steelworkers of our country out of work and out of business. That will never happen when I am president. Our steelworkers and our miners are going back to work again. With these new economic policies, trillions of dollars will start flowing into our country.
This new wealth will improve the quality of life for all Americans. We will build the roads, highways, bridges, tunnels, airports and the railways of tomorrow. This, in turn, will create millions of more jobs. We will rescue kids from failing schools by helping their parents send them to a safe school of their choice.
My opponent would rather protect bureaucrats than serve American children. And that’s what she’s doing, and that’s what she’s done.
We will repeal and replace disastrous Obamacare. You will be able to choose your own doctor again.
And we will fix TSA at the airports! Which is a total disaster. Thank you, thank you.
We’re going to work with all of our students who are drowning in debt to take the pressure off these people just starting out in their adult lives. Tremendous problem.
Follow our daily presidential tracking poll »
We will completely rebuild our depleted military. And the countries that we are protecting, at a massive cost to us, will be asked to pay their fair share.
We will take care of our great veterans like they have never been taken care of before. My just released 10-point plan has received tremendous veterans’ support. We will guarantee those who serve this country will be able to visit the doctor or hospital of their choice without waiting five days on a line and dying.
My opponent dismissed the VA scandal – one more sign of how out of touch she really is. We are going to ask every department head in government to provide a list of wasteful spending on projects that we can eliminate in my first 100 days. The politicians have talked about this for years, but I’m going to do it.
We are going to appoint justices of the United States Supreme Court who will uphold our laws and our Constitution.
The replacement of our beloved Justice Scalia will be a person of similar views, principles and judicial philosophies. Very important. This will be one of the most important issues decided by this election.
My opponent wants to essentially abolish the 2nd Amendment. I, on the other hand, received the early and strong endorsement of the National Rifle Assn. and will protect the right of all Americans to keep their families safe.
At this moment, I would like to thank the evangelical and religious community because I’ll tell you what, the support they’ve given me, and I’m not sure I totally deserve it, has been so awesome and has had such a big reason for me being here tonight. True, so true.
They have much to contribute to our politics, yet our laws prevent you from speaking your minds from your own pulpits.
An amendment which, by Lyndon Johnson, many years ago, threatens religious institutions with a loss of their tax-exempt status if they openly advocate their political views. I am going to work very hard to repeal that language and protect free speech for all Americans.
We can accomplish these great things, and so much more – all we need to do is start believing in ourselves and in our country again. It is time to show the whole world that America is back – bigger and better and stronger than ever before.
In this journey, I’m so lucky to have at my side my wife Melania and my wonderful children Don, Ivanka, Eric, Tiffany and Barron. You will always be my greatest source of pride and joy. And by the way, Melania and Ivanka, did they do a job. My dad, Fred Trump, was the smartest and hardest-working man I ever knew. I wonder sometimes what he’d say if he were here to see this and to see me tonight.
It’s because of him that I learned, from my youngest age, to respect the dignity of work and the dignity of working people. He was a guy most comfortable in the company of bricklayers and carpenters,and electricians. And I have a lot of that in me also. I love those people. Then there’s my mother, Mary. She was strong but also warm and fair-minded. She was a truly great mother. She was also one of the most honest and charitable people that I have ever known, and a great, great judge of character. She could pick ’em out from anywhere.
To my sisters Mary Anne and Elizabeth, my brother Robert and my late brother Fred, I will always give you my love. You are most special to me.
I have had a truly great life in business. But now, my sole and exclusive mission is to go to work for our country – to go to work for all of you. It’s time to deliver a victory for the American people. We don’t win anymore, but we’re going to start winning again! But to do that, we must break free from the petty politics of the past.
America is a nation of believers, dreamers and strivers that is being led by a group of censors, critics and cynics.
Remember: All of the people telling you you can’t have the country you want are the same people telling you that wouldn’t stand. I mean they said Trump doesn’t stand a chance of being here tonight, not a chance. The same people. Oh, we love defeating those people don’t we. We love defeating them. Love it, love it. No longer can we rely on those elites in media and politics who will say anything to keep our rigged system in place.
Instead, we must choose to believe In America. History is watching us now. We don’t have much time. But history is watching. It’s waiting to see if we will rise to the occasion, and if we will show the whole world that America is still free and independent and strong.
I am asking for you to support tonight so that I can be your champion in the White House. And I will be your champion. My opponent asks her supporters to recite a three-word loyalty pledge. It reads: “I’m With Her.” I choose to recite a different pledge.
My pledge reads: “I’m With You – The American People.”
I am your voice.
So to every parent who dreams for their child and every child who dreams for their future, I say these words to you tonight: I am with you. I will fight for you, and I will win for you.
To all Americans tonight, in all of our cities and all of our towns, I make this promise: We will make America strong again.
We will make America proud again.
We will make America safe again.
And we will make America great again.
God bless you and goodnight. I love you.
Twitter: @latimespolitics
Sign up for our Essential Politics newsletter