money

Ooma Reports Record Q2 Profit Growth

Ooma (OOMA 2.17%) reported second quarter 2026 earnings on August 26, 2025, reporting revenue of $66.4 million, up 3.5% year over year, a record non-GAAP net income of $6.5 million, up 59% year over year, and an adjusted EBITDA margin rising to 11%. Management highlighted strengthening business user metrics, Airdial’s accelerated bookings, expanded partner ecosystem, and updated full-year non-GAAP net income guidance to $24.5 million to $25 million for FY2026, raising previous expectations.

Airdial bookings drive Ooma business revenue and partner expansion

Product and other revenue grew 15% year over year in Q2 FY2026, attributed largely to increased Airdial installations, while the company now partners with nearly 35 Airdial resellers, up sequentially. Airdial landed its largest customer to date, a national U.S. retailer deploying to over 3,000 locations.

“I’m pleased to report that Airdial ramped well in Q2. We more than doubled new bookings year over year and secured our largest customer win to date with a large national retailer. Started the rollout with this retailer and anticipate serving over 3,000 locations. We also closed several other significantly sized customers who placed initial orders. As is our goal every quarter, we expanded the number of partners who will resell Airdial, and signed three new partner resellers in the quarter. We believe two of these new partners have experience selling competitive solutions and will be able to ramp relatively quickly with Airdial. In total, we are now approaching 35 Airdial partner resellers.”
— Eric Stang, CEO

With bookings more than doubling year over year and rapid channel expansion in Q2 FY2026, Airdial is contributing to the growth of Ooma’s annual recurring revenue and business user additions.

Ooma reaches record profitability through operational leverage

Adjusted EBITDA rose 27% year over year to $7.2 million, with non-GAAP net income driven by improving operating leverage, R&D efficiency, and a disciplined cost structure. The company’s gross margin remained stable year over year at 62%, Sales and marketing expenses were $18 million or 27% of total revenue, up 2% year over year, while research and development expenses were $11.5 million or 17% of total revenue, down 6% year over year.

“Q2 non-GAAP net income was $6.5 million, above our guidance range of $5.6 million to $5.9 million, and grew 59% year over year, primarily driven by our improving operating leverage. Q2 non-GAAP net income this year also included a small amount of tax benefit due to the recent changes in U.S. tax law.”
— Shig Hamamatsu, CFO

This margin expansion and stronger bottom-line output indicate Ooma’s ability to balance growth investments with profitable scalability, underpinning an attractive long-term financial profile for investors.

Business solutions segment outpaces residential as key revenue driver

Business subscription and services revenue represented 62% of total subscription revenue, up from 60% in the previous quarter, and grew 66% year over year, while residential subscription revenue declined by 2% year over year. Blended average revenue per user (ARPU) climbed 4% year over year to $15.68, propelled by the increased mix of business users and higher-tier Ooma Office Pro and Pro Plus services adoption, with 61% of new Office users opting for premium tiers.

“Business subscription and services revenue grew 66% year over year in Q2 driven by user growth and ARPU growth. On the residential side, subscription and services revenue was down 2% year over year. For the second quarter, total subscription and services revenue was $61.1 million or 92% of total revenue as compared to $59.6 million or 93% of total revenue in the prior year quarter.”
— Shig Hamamatsu, CFO

The business segment grew rapidly, driven by higher customer value and increased premium service adoption, reflecting a shift toward business customers.

Looking Ahead

Management guided non-GAAP revenue for Q3 FY2026 to $67.2 million to $67.9 million and full-year non-GAAP revenue to $267 million to $270 million for FY2026, with non-GAAP net income for FY2026 now expected at $24.5 million to $25 million, raising prior guidance. Adjusted EBITDA for FY2026 is forecast at $28.5 million to $29 million, and non-GAAP diluted EPS at $0.87 to $0.89 for FY2026, with business subscription and services revenue projected to grow 5% to 6% for FY2026 on a non-GAAP basis, while residential declines 1% to 2%. Management’s strategic priorities remain capitalizing on Airdial expansion, enhancing Ooma Office for higher ARPU, and scaling wholesale platform 2,600 Hertz, and further cost efficiency gains anticipated through the second half of FY2026.

This article was created using Large Language Models (LLMs) based on The Motley Fool’s insights and investing approach. It has been reviewed by our AI quality control systems. Since LLMs cannot (currently) own stocks, it has no positions in any of the stocks mentioned. The Motley Fool has no position in any of the stocks mentioned. The Motley Fool has a disclosure policy.

Source link

PVH Posts 4% Revenue Gain in Fiscal Q2

PVH (PVH 1.09%), the owner of Calvin Klein and Tommy Hilfiger, reported its fiscal second quarter earnings on August 26, 2025. The Q2 FY2025 results featured better-than-expected revenue (GAAP) and earnings (non-GAAP), but gross margin declined in Q2 FY2025 compared to the prior year. Non-GAAP EPS of $2.52 for Q2 FY2025 exceeded guidance of $1.85–$2.00, although it fell short of last year’s $3.01. Total revenue (GAAP) for Q2 FY2025 was $2.17 billion, up 4% in the second quarter of 2025 compared to the same period last year and above expectations for a “low single digit” revenue increase in Q2 FY2025. Overall, the quarter delivered sales outperformance and showed core brand resilience but also highlighted persistent cost, margin, and inventory challenges.

Metric Q2 2025 Q2 2024 Y/Y Change
EPS (Non-GAAP) $2.52 $3.01 (16.3 %)
Revenue (GAAP) $2.17 billion $2.07 billion 4.8 %
Revenue vs. Guidance Midpoint (Non-GAAP) Exceeds low single-digit increase guidance; in line with constant currency guidance
Operating Margin (Non-GAAP) 8.2 % N/A N/A
EPS (GAAP) $4.63 $2.80 65.4%
Inventory $1.79 billion $1.58 billion 13.3 %

Source: Analyst estimates provided by FactSet. Management expectations based on management’s guidance, as provided in Q1 2025 earnings report.

Business Overview and Recent Priorities

PVH is a global apparel company known primarily for its Calvin Klein and Tommy Hilfiger brands. It operates in over 40 countries through wholesale, retail, and digital platforms, with its core offering being branded clothing and accessories. Together, Calvin Klein and Tommy Hilfiger accounted for more than 90% of PVH’s revenue in FY2024, reflecting their central importance.

Recent business focus has centered on strengthening its core brand positioning, expanding digital commerce offerings, and bringing more product categories in-house rather than licensing them out. Within this strategy, success depends on steady demand for branded products, investment in marketing and innovation, a balanced global footprint, and supply-chain resilience. The ability to manage costs while maintaining brand value and adapting to shifting consumer behavior is crucial for PVH’s longer-term growth.

Quarterly Developments and Performance Drivers

In Q2 FY2025, PVH posted GAAP revenue growth above expectations, led by both Calvin Klein and Tommy Hilfiger. Tommy Hilfiger generated $1,135.9 million in sales in Q2 FY2025, up 3.9% year over year (GAAP). Calvin Klein delivered $980 million in revenue (GAAP) for Q2 FY2025, rising 5.3%. The Americas region was a particularly strong driver, with 11% revenue growth in Q2 FY2025, attributed mainly to wholesale and from moving previously licensed women’s categories in-house in Q2 FY2025, which shifted revenue streams and timing. Europe, the Middle East, and Africa (EMEA) saw a smaller gain of 3.4% in Q2 FY2025 (GAAP), but on a constant-currency (non-GAAP) basis, it was down 3% in Q2 FY2025. Asia-Pacific region revenue fell 1% year over year in Q2 FY2025 (GAAP), mainly due to continued pressure in China and a soft wholesale market.

Direct-to-consumer (DTC) channels, including the company’s own stores and e-commerce platforms, recorded 3.7% revenue growth in Q2 FY2025. However, when excluding exchange rate effects, DTC was flat. Digital commerce specifically was up 3% in Q2 FY2025, but also flat in constant currency, indicating that digital sales are not yet outpacing the overall market or translating brand engagement into rapid growth.

Gross margin, the percentage of sales remaining after accounting for production and sourcing costs, declined from 60.1% in the prior year period to 57.7% in Q2 FY2025 on a GAAP basis. Management attributed this decline in Q2 FY2025 to several factors, including promotional discounting, cost pressures from higher tariffs on goods imported into the U.S, and the impact of bringing previously licensed women’s categories in-house. These in-house transitions typically generate more reported revenue but often at a lower margin at the outset. Additional sources of margin impact in Q2 FY2025 included an unfavorable mix between wholesale and retail channels, increased freight costs, and some incremental discounting to customers as a result of Calvin Klein delivery delays.

Inventories at the end of Q2 FY2025 were up 13% from the prior year. Management described this build as mostly strategic, aiming to ensure better availability of “core” product categories, especially moving into the next quarter. This can aid sales if demand holds, but it also introduces risk if the market stalls and excess stock leads to heavier discounting. Licensing revenue—money earned from letting other companies use PVH’s brands—declined 3% year over year in Q2 FY2025 as women’s product lines shifted from licensing to direct management. No significant new acquisitions or licensing expansions were announced during the quarter.

In terms of product lines, Calvin Klein’s best performance was in underwear and fashion denim, with management highlighting product innovation and new marketing campaigns featuring celebrity talent like Bad Bunny. Tommy Hilfiger focused on summer campaigns including collaborations with major sports events and teams, such as the F1® The Movie and the US SailGP racing team. Both major brands benefited from targeted investment in product innovation and broad marketing engagement, though the company did not break out detailed sales growth numbers for specific sub-categories beyond the main brands.

The ongoing transition of product categories from licensed to in-house models as part of the branded strategy had notable financial effects. While this contributed to higher reported revenue in Q2 FY2025, it initially pressured gross margins and reduced licensing income. The company also continues to face increased U.S. tariffs, which are expected to produce a $1.15 per share drag on FY2025 non-GAAP earnings per share, up from previous projections of $1.05. Ongoing operational initiatives are aimed at mitigating these cost pressures, but full offset has yet to be realized.

Looking Ahead: Management Guidance and Key Issues

Management updated full-year revenue guidance for FY2025 to “increase slightly to up low single digits,” an improvement from previous forecasts of “flat to increase slightly.” The outlook for full-year non-GAAP operating margin held steady at about 8.5% for FY2025, a significant step down from last year’s 10.0% non-GAAP margin. Full-year non-GAAP earnings per share guidance for FY2025 was reaffirmed at $10.75–$11.00, compared to $11.74 (non-GAAP) last year, and continues to reflect substantial tariff-related and margin headwinds. Q3 FY2025 is projected to see flat to modest revenue growth and non-GAAP EPS between $2.35 and $2.50, compared to $3.03 in Q3 FY2024.

Investors and observers will want to track whether inventory build translates into improved sales or heavier future markdowns, as well as any recovery in Asia-Pacific performance. Additional focus areas include the ability to maintain brand health, especially as elevated promotional activity persists and margin recovery efforts continue. Management flagged continued cost pressures, especially from tariffs and promotional activity, while reiterating its focus on digital and brand-building initiatives. No dividend is currently paid on PVH shares.

Revenue and net income presented using U.S. generally accepted accounting principles (GAAP) unless otherwise noted.

Source link

Meet the Magnificent “Ten Titans” Growth Stock With a 7.5% Weighting in the S&P 500 That Could Single-Handedly Move the Stock Market on Aug. 28

In just a few years, Nvidia has become the most valuable company in the world, and also one of the most profitable.

The S&P 500 and Nasdaq Composite are hovering around all-time highs. A big part of the rally is investor excitement for sustained artificial intelligence (AI)-driven growth and adjustments to Federal Reserve policy that open the door to interest rate cuts.

While investor sentiment and macroeconomic factors undoubtedly influence short-term price action, the stock market’s long-term performance ultimately boils down to earnings.

Nvidia (NVDA 1.10%) will report its second-quarter fiscal 2026 earnings on Aug. 27 after market close. Here’s why expectations are high, and why the “Ten Titans” stock could single-handedly move the S&P 500.

A person tipping a scale that holds coins on one side and nothing on the other.

Image source: Getty Images.

Nvidia’s profound impact on the S&P 500

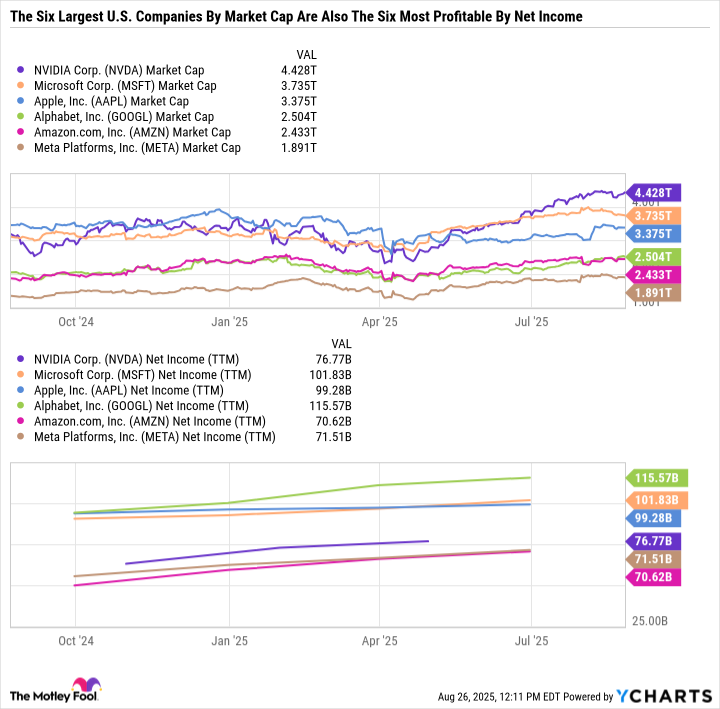
The Ten Titans are the largest growth stocks by market cap — making up a staggering 38% of the S&P 500.

Nvidia is the largest — with a 7.5% weighting in the index.

The other Titans are Microsoft, Apple, Amazon, Alphabet, Meta Platforms, Broadcom, Tesla, Oracle, and Netflix.

Aside from its value, Nvidia is also a major contributor to S&P 500 earnings growth.

NVDA Market Cap Chart

NVDA Market Cap data by YCharts

Megacap tech companies influence the value of the S&P 500 and its earnings. And since many of the top earners are growing quickly, the market arguably deserves to have a premium valuation.

Since the start of 2023, Nvidia added roughly $4 trillion in market cap to the S&P 500. But it also added over $70 billion in net income — as its trailing-12-month earnings went from just $5.96 billion at the end of 2022 to $76.8 billion today. That’s like creating the combined earnings contribution of Bank of America, Walmart, Coca-Cola, and Costco Wholesale in the span of less than three years.

Nvidia’s value creation for its shareholders, and the scale of just how big the business is from an earnings standpoint, is unlike anything the market has ever seen. But investors care more about where a company is going than where it has been.

Nvidia’s unprecedented profit growth

Expectations are high for Nvidia to continue blowing expectations out of the water. Over the last three years, Nvidia’s stock price rose after its quarterly earnings report 75% of the time. Analysts have spent the last few years flat-footed and scrambling to raise their price targets as Nvidia keeps raising the bar. It looks like they aren’t making that mistake any longer — as near-term forecasts are incredibly ambitious.

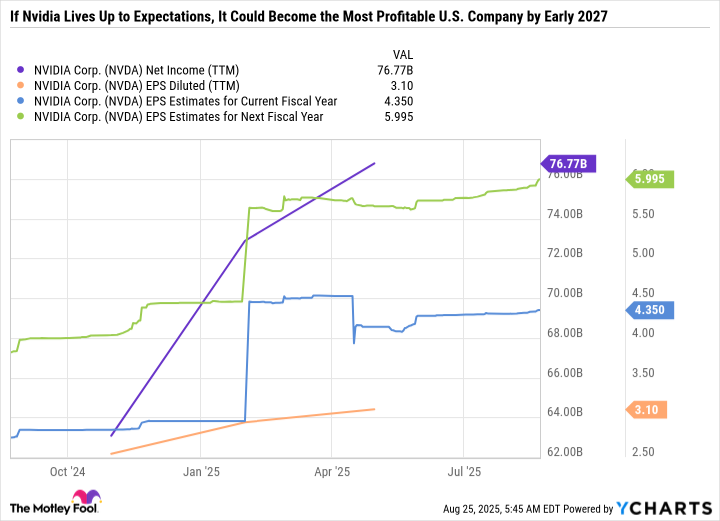
As mentioned, Nvidia’s trailing-12-month net income is $76.8 billion, which translates to $3.10 in diluted earnings per share (EPS). Consensus analyst estimates have Nvidia bringing in $1 per share in earnings for the quarter it reports on Wednesday and $4.35 for fiscal 2026. Going out further, analyst consensus estimates call for 37.8% in earnings growth in fiscal 2027, which would bring Nvidia’s diluted EPS to $6 per share.

NVDA Net Income (TTM) Chart

NVDA Net Income (TTM) data by YCharts

Based on Nvidia’s current outstanding share count, that would translate to net income of $107.7 billion in fiscal 2026 and $148.5 billion in fiscal 2027. Unless other leaders like Alphabet, Microsoft, or Apple accelerate their earnings growth rates, Nvidia could become the most profitable U.S. company by the time it closes out fiscal 2027 in January of calendar year 2027. These projections strike at the core of why some investors are willing to pay so much for shares in the business today.

The key to Nvidia’s lasting success

Nvidia can single-handedly move the stock market due to its high weighting in the S&P 500. However, its influence goes beyond its own stock, as strong earnings from Nvidia could also be a boon for other semiconductor stocks, like Broadcom. But the ripple effect is even more impactful.

In Nvidia’s first quarter of fiscal 2026, four customers made up 54% of total revenue. Although not directly named by Nvidia, those four customers are almost certainly Amazon, Microsoft, Alphabet, and Meta Platforms. So strong earnings from Nvidia would basically mean that these hyperscalers continue to spend big on AI — a positive sign for the overall AI investment thesis.

However, Nvidia’s long-term growth and the stickiness of its earnings ultimately depend on its customers translating AI capital expenditures (capex) into earnings — which hasn’t really happened yet.

ORCL CAPEX To Revenue (TTM) Chart

ORCL CAPEX To Revenue (TTM) data by YCharts

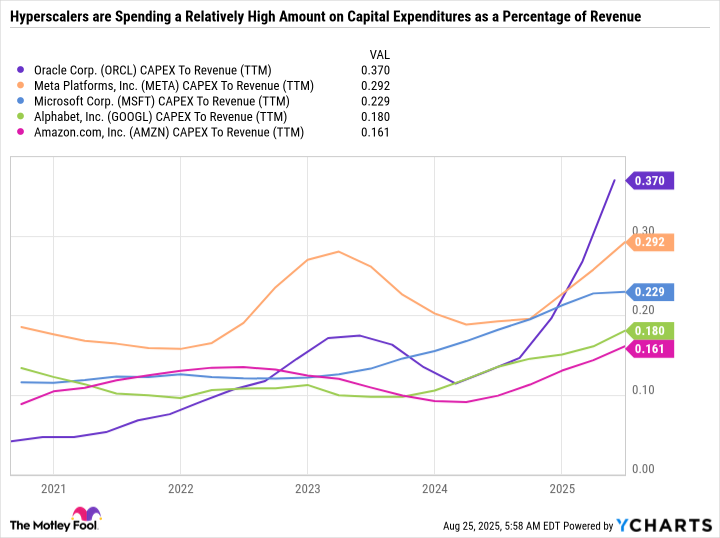
Cloud computing hyperscalers are spending a lot on capital expenditures (capex) as a percentage of revenue — showcasing accelerated investment in AI. But eventually, the ratio should decrease if investments translate to higher revenue.

Investors may want to keep an eye on the capex-to-revenue metric because it provides a reading on where we are in the AI spending cycle. Today, it’s all about expansion. But soon, the page will turn, and investors will pressure companies to prove that the outsize spending was worth it.

The right way to approach Nvidia

Almost all of Nvidia’s revenue comes from selling graphics processing units, software, and associated infrastructure to data centers. And most of that revenue comes from just a handful of customers. It doesn’t take a lot to connect the dots and figure out just how dependent Nvidia is on sustained AI investment.

If the investments pay off, the Ten Titans could continue making up a larger share of the S&P 500, both in terms of market cap and earnings. But if there’s a cooldown in spending, a downturn in the business cycle, or increased competition, Nvidia could also sell off considerably. So it’s best only to approach Nvidia with a long-term investment time horizon, so you aren’t banking on everything going right over the next year and a half.

All told, investors should be aware of potentially market-moving events but not overhaul their portfolio or make emotional decisions based on quarterly earnings.

Bank of America is an advertising partner of Motley Fool Money. Daniel Foelber has positions in Nvidia. The Motley Fool has positions in and recommends Alphabet, Amazon, Apple, Costco Wholesale, Meta Platforms, Microsoft, Netflix, Nvidia, Oracle, Tesla, and Walmart. The Motley Fool recommends Broadcom and recommends the following options: long January 2026 $395 calls on Microsoft and short January 2026 $405 calls on Microsoft. The Motley Fool has a disclosure policy.

Source link

Why Cronos Is Skyrocketing Today

A major deal was announced today that sent Cronos flying.

Cronos (CRO 28.99%) is flying higher on Tuesday, up 24.9% in the last 24 hours as of 1:38 p.m. ET today. The spike comes as the S&P 500 and the Nasdaq Composite are little changed.

Cronos, the token of the major exchange Crypto.com, is jumping after news broke that Crypto.com and Trump Media & Technology are teaming up to create a new company that will acquire Cronos.

Trump Media will add Cronos

The parent company of Truth Social, Trump Media, will partner with Crypto.com to create a new entity that will be taken public via a SPAC deal. The entity will merge with Yorkville Acquisition and be listed under the ticker MCGA. The deal is funded with $1 billion in CRO tokens, $200 million in cash, $220 million in warrants, and an equity line of up to $5 billion from a Yorkville affiliate.

As part of the deal, Trump Media will purchase around $100 million in Cronos to add to its own books, while Crypto.com will buy roughly $50 million in Trump Media stock.

The deal to accumulate Cronos mirrors the same strategy by Trump Media to accumulate Bitcoin on its own books, which the company modeled after a strategy that was pioneered by Michael Saylor’s MicroStrategy (doing business as Strategy). However, this deal is unique in that the target asset is a relatively minor altcoin at least in comparison to Bitcoin or Ethereum, which most other companies have targeted to this point.

A group of people look at their smartphones.

Image source: Getty Images.

While the news led to a rush of investors purchasing Cronos, I would stay away from this token for now. There is likely to be a lot of volatility around this deal, just as there is a lot of volatility around Trump Media stock. If you’re interested in investing in cryptocurrency, stick to Bitcoin or Ethereum.

Johnny Rice has no position in any of the stocks mentioned. The Motley Fool has positions in and recommends Bitcoin and Ethereum. The Motley Fool has a disclosure policy.

Source link

Why Trump Media Stock Is Jumping Today

Trump Media is teaming up with Crypto.com to create a new entity that will accumulate CRO.

Shares of Trump Media & Technology Group (DJT 6.62%) are jumping on Monday, up 7% as of 1:34 p.m. ET. The jump comes as the S&P 500 and the Nasdaq Composite are little changed.

Trump Media, the parent company of Truth Social, is teaming up with a major cryptocurrency exchange to launch a new company that will adopt a crypto accumulation strategy.

Trump Media will add Cronos to its books

The new company will build a significant position in Cronos (CRO), the crypto token of Crypto.com, and go public via the special purpose acquisition company (SPAC) Yorkville Acquisition, with the ticker MCGA.

The venture’s funding mix includes about $1 billion of CRO tokens, $200 million in cash, $220 million in warrants, and an equity line up to $5 billion from a Yorkville affiliate. Trump Media plans to buy roughly $105 million of CRO for its balance sheet, and Crypto.com will invest roughly $50 million in Trump Media stock.

This comes after Trump Media jumped on the crypto accumulation strategy bandwagon recently, purchasing large amounts of Bitcoin using a mix of debt and equity sales. The strategy was pioneered by Michael Saylor’s MicroStrategy (doing business as Strategy) and is a high-risk move that could pay off if Bitcoin continues to rise in price significantly.

Bitcoin symbol on Wall Street.

Image source: Getty Images.

Trump Media’s valuation is divorced from reality

The latest move from Trump Media is its latest attempt to generate value. The company’s main asset, Truth Social, is a money-losing machine. At the moment, Trump Media has annual revenue of a few million dollars and is losing money hand over fist, yet its stock carries a valuation above $5 billion. The company’s pivot into Bitcoin accumulation (and now Cronos accumulation) requires taking on significant debt or diluting its stock through equity sales. It’s not a gambit I think will pay off. This is not a stock you want to own.

Johnny Rice has no position in any of the stocks mentioned. The Motley Fool has positions in and recommends Bitcoin. The Motley Fool has a disclosure policy.

Source link

BW LPG (BWLP) Q2 2025 Earnings Call Transcript

Logo of jester cap with thought bubble.

Image source: The Motley Fool.

DATE

Tuesday, August 26, 2025 at 8:00 a.m. ET

CALL PARTICIPANTS

Chief Executive Officer — Kristian Sorensen

Chief Financial Officer — Samantha Xu

Need a quote from a Motley Fool analyst? Email [email protected]

TAKEAWAYS

Time Charter Equivalent (TCE) Income— $38,800 per available day and $37,300 per calendar day, both above prior guidance of $35,000 per day.

Profit After Tax (Attributable to Equity Holders)— $35 million profit with earnings per share of $0.23.

Dividend Declared— $0.22 per share dividend declared, representing 75% of shipping NPAT, supplemented by retained dividends from Product Services 2024 results.

Product Services Segment Profit After Tax— $6 million net profit after tax for Product Services, with realized gross profit of $15 million.

Aggregate Realized Product Services Profit YTD— $39 million as of June 30, 2025.

Dry Docking Days— 139 days in Q2 2025; management expects 143 days in Q3 and 135 days in Q4 2025, impacting available earning capacity.

Third Quarter Guidance— Approximately $53,000 per day fixed for 90% of available days, exceeding all-in cash breakeven of $24,800 per day for the year 2025.

Financing Activity— New $380 million term loan and revolving facility secured for advanced gas fleet, plus $215 million term loan facility for BW LPG India; $250 million shareholder loan terminated early.

Fleet Composition and Growth— 409 VLGCs in service globally as of Q2 2025, with only 7 new deliveries expected in 2025 and an order book of 111 vessels.

Time Charter Portfolio Exposure— 44% of shipping exposure, including 32% fixed rate; Q3 2025 fixed at 90% of available days.

Segment Profitability— the balance of fixed time charter out estimated to contribute $74 million in the second half of 2025.

Net Leverage Ratio— 31% in Q2, down from 33% at the end of last year primarily due to lease liability reduction.

Operating Expenses (OpEx)— $9,000 per day OpEx in Q2 2025; own fleet operating cash breakeven expected at $19,100 per day for full year 2025 and total fleet at $21,700 per day for full year 2025; all-in cash breakeven projected at $24,800 per day for the year.

Liquidity Position— $287 million in cash at the end of Q2 and $421 million in undrawn revolving credit lines at quarter end.

Trade Finance Utilization— $303 million trade finance utilization, equating to 38% of total available credit for trading activities.

Kristian Sorensen— “VLGC market is characterized by solid fundamentals with robust growth in export volumes from the U.S. and Middle East; fleet inefficiencies and Panama Canal congestion are absorbing capacity and elevating rates, with spot rates reaching above $70,000 per day for certain routes as reported in Q2 2025.

Product Services Value at Risk— Average bar value at risk was $6 million, reflecting a balanced trading book.

Return Metrics— Shareholders’ equity was $1.9 billion as of Q2 2025; annualized return on equity and capital employed were 98%, respectively.

SUMMARY

Management highlighted a volatile quarter driven by exceptional geopolitical disruptions and shifting trade flows, resulting in elevated freight rates and increased demand for very large gas carriers (VLGCs). The company’s ongoing drydocking program is expected to constrain operational days through Q4, which may affect near-term capacity and reported income. BW LPG Limited’s time charter strategy has provided downside protection but has also limited exposure to recent spot rate surges, influencing guidance for Q3 2025. Liquidity remains robust following recent financings and early loan repayments, with the next major maturity not due until 2029. Management underscored the significant impact of Panama Canal congestion and evolving cargo flow patterns on market fundamentals.

CEO Sorensen stated, “the supply-demand balance in the VLGC market is tight, and the bargaining power is in the shipping market’s favor.”

Samantha Xu said the reported net asset value for Product Services does not include a $10 million unrealized physical shipping position as of Q2 2025, indicating additional latent value not recognized in current financials.

Fleet renewal and newbuild activity remain limited in the near term, with only seven new VLGCs expected for delivery in 2025 and approximately 60 ships in the global fleet over 20 years of age.

Spot rates above $70,000 per day are described as sustainable by management under current conditions, though potential downside risk remains if market dynamics shift.

The CFO cautioned that unrealized gains and losses for Product Services will continue to see fluctuations before the positions are realized, underscoring ongoing earnings variability tied to market volatility.

INDUSTRY GLOSSARY

VLGC (Very Large Gas Carrier): Ocean-going vessel designed for the bulk transport of liquefied petroleum gas (LPG), typically with a capacity exceeding 80,000 cubic meters.

FFA (Forward Freight Agreement): Derivative contract used for hedging freight rate exposure by locking in future shipping rates for a particular route and timeframe.

Tonne Mile: A demand metric calculated as the volume of goods shipped multiplied by the distance transported, reflecting overall transportation demand in shipping markets.

NPAT: Net Profit After Tax; company earnings after all expenses and taxes.

Full Conference Call Transcript

Kristian Sorensen: Thank you, Aline, and hello, everyone, and thank you for taking the time to be with us today as we review our second quarter financial results and recent relevance. So let’s turn to Slide four, please. The second quarter was marked by extraordinary geopolitical and market events, which substantially increased the market volatility both for shipping and trading. For the quarter, we reported a TCE income of $38,800 per available day and $37,300 per calendar day, above our guidance of $35,000 per day. In a quarter with spot rates fluctuating between $10,000 and $70,000 per day, the time charter portfolio played a vital role in protecting our downside.

After minority interests, the Q2 profit was $35 million, equivalent to an EPS of $0.23. And the Board of Directors has declared dividends of $0.22 per share, consisting of 75% of our shipping NPAT, topped up with retained dividends from Product Services 2024 results. Moving on to our trading operations. Product Services achieved a gross profit of $15 million and a profit after tax of $6 million. Samantha will take you through the details later in the presentation. And it’s important to keep in mind that it is the realized result, which generates Product Services dividend capacity. As of June 30th, the aggregated realized result for 2025 is $39 million.

Further on our shipping activities, 2025 is a busy drydocking year for us. In the second quarter, we had 139 days related to vessels drydocking. In the second half of the year, we expect 143 and 135 days, respectively, for Q3 and Q4. These numbers should be noted since they impact our revenue-generating potential on top of the drydocking cost itself. For the third quarter, we are guiding on about $53,000 per day fixed for 90% of our available days. These are solid levels above our all-in cash breakeven of $24,800 per day. On the asset side, BWG was added to our own fleet in June after we declared a very lucrative purchase option earlier this year.

On financing, we finalized a $380 million term loan and revolving credit facility to finance the advanced gas fleet and secured a $215 million term loan facility for BW LPG India fleets. Our $250 million shareholder loan from BW Group was terminated earlier due to ample liquidity. But now that Q2 is over, the focus is on 2025, which has started off on a strong note. So let’s turn to the next slide, please. The current VLGC market is characterized by solid fundamentals with robust growth in export volumes from the U.S., supported by high domestic LPG production and ongoing terminal expansions. The Middle East volumes are also slightly up, backed by a reversal of the OPEC cuts.

The extraordinary factor is how inefficiencies in the LPG trade pattern have absorbed substantial shipping capacity in recent months. The first such inefficiency emerged after China imposed retaliatory tariffs on U.S.-sourced LPG, which led to a significant reshuffling of U.S. export volumes away from China and into other parts of Asia. The sudden shift of U.S. volumes toward India and Southeast Asia, combined with the redirection of Middle East volumes to China rather than India, absorbed considerable capacity from the VLGC fleet and pushed rates up. The short but intense Israel-Iran conflict also fueled spot rates for ships loading around that period in the Middle East.

Now trade patterns are slowly returning to pre-trade workflows, but the Panama Canal has once again become a bottleneck as growing traffic from container ships, ethane carriers, and other prioritized or high-paying segments strains capacity. The consequence has been more VLGCs routing around South Africa, which significantly impacts the tonne mile for the global VLGC fleets, making fewer ships available, which, in turn, is pushing rates up. In addition, the global fleet growth is at a low level, with 409 ships currently in service and only seven more to be delivered in 2025.

We keep an eye on the LPG FFA market, which is currently pricing the balance of 2025 at an equivalent of low $60,000 per day for the Middle East Japan benchmark leg. Next slide, please. This slide shows how the LPG market dynamics played out after the Chinese retaliatory tariffs were implemented. The U.S. LPG export volumes shifted from Chinese destinations to India, but also Japan took a big chunk of the rerouted cargoes. U.S. LPG exports to India were above 1 million tonnes in 2025 compared to less than 100,000 tonnes for the entire 2024.

Middle Eastern volumes also played a key role by replacing U.S. cargoes to China, thereby redirecting traditional cargo flows for India to longer haul destinations in China and absorbing more shipping capacity. Furthermore, China substituted U.S. LPG with cargoes from Canada and Australia, a trend that we see continues. All in all, the massive reshuffling of cargoes that took place was creating substantial inefficiencies in the LPG supply chain, which required more shipping capacity and moved rates up. The trade pattern is now pivoting towards the pre-liberation day structure in anticipation for a trade deal between the U.S. and China. But the Panama Canal has created new inefficiencies for the fleets. Next slide, please.

In 2023, 2024, we all spent significant time analyzing the Panama Canal dynamics. Now with the canal regaining relevance, it’s worth revisiting its key aspects driving our markets. The new Panama Canal locks have a daily capacity of around 10 ships in total combined for both directions. VLGCs have over the last years taken up between two to three of these 10 transit slots. As previously explained, VLGCs are not prioritized through the canal during periods of increased traffic. So when waiting times become excessive or auction fees for available slots are prohibitively high, the alternative is to route vessels around the Cape Of Good Hope.

And this rerouting increases sailing distances by up to 50% compared with the Panama Canal route to Northeast Asia and has an immediate and material impact on the VLGC market by raising demand for tonnage to offset the longer voyages. Monitoring developments in the Panama Canal will therefore be important in assessing the direction of the VLGC freight rates going forward. The increased demand for shipping capacity has pushed spot rates up to a level above $70,000 per day for loading in the U.S. Gulf. As you can see from the graphs on this page, shipping is currently capturing almost all the profit in moving cargoes from the U.S.

Gulf to the Far East, and there is very little room left for profit on the cargo price itself. Demand for vessels, driven by increased export volumes and the aforementioned inefficiencies, is growing faster than the capacity of the VLGC fleets. And the upcoming export terminal expansions will likely lend support to shipping share of the U.S. Far East arbitrage. In the LPG value chain, there is a daily arm wrestling going on between terminals, cargo owners, and the shipping market on capturing as much as possible of the price difference between the U.S. and the landed price in Asia.

For the time being, the supply-demand balance in the VLGC market is tight, and the bargaining power is in the shipping market’s favor. On that note, I’d like to remind you how this may impact the Q3 accounting result for Product Services since the change in the mark to market valuation of their shipping portfolio is not captured in the P&L, while forward cargo and paper positions are included. Looking ahead on this slide, the U.S. export volumes are forecasted to continue growing on the back of increased production of LPG.

The crude oil wells in the Permian Basin are more gaseous than we expected some years ago, and the gas production is forecasted to grow at least twice as much annually as the crude oil production, where lower growth figures are expected in the next five years’ periods. The growth in U.S. LPG exports is supported by several terminal expansions from now into 2028. And Energy Transfer has already started their LPG exports from their Nederland terminal expansion. Moving over to the Middle East. The export growth is forecasted to accelerate next year with Qatar leading the way as well as Abu Dhabi. In neighboring Saudi Arabia, the Jafura project is worth keeping an eye on.

Although it’s further out in time, the size of the LPG volumes made available for exports are potentially adding another 5 to 10 million tons of LPG to the growing volumes from the Middle East. On the fleet and newbuilding front, there is little new to report and the order book counts 111 additional vessels to the current fleet of 409 vessels where about 15% equal to 60 ships and thereabouts are older than 20 years. And then it’s over to you, Samantha.

Samantha Xu: Thank you, Kristian, and hello, everyone. Let’s dive into our shipping performance. The 2025 completed with the TCE of $37,300 per calendar day or $38,800 per available day, over 94% fleet utilization after deducting technical off hire and waiting time. The healthy result achieved in a volatile market was a strong testament to our commercial strategy, consistently taking on time charter and FFA for coverage in a strong market to provide support when spot markets are under pressure. In Q2, the time charter portfolio was 44% of the total shipping exposure, amount of which 32% is fixed rate time charter.

Looking ahead for Q3 2025, we have fixed 90% of the available fleet days at an average rate of about $53,000 per day. For the second half of 2025, we have secured 34% of our portfolio with fixed rate time charter and FFA hedge respectively at $45,200 and $51,700 per day. Our time charter out fleet is estimated to generate a profit of around $9 million over our time charter in fleet. On top of that, the balance of our fixed time charter out of portfolio is estimated to generate $74 million. On the product services side, the business posted a realized gain of $6 million for Q2.

The positive result reflected a disciplined approach and effective risk management in a volatile quarter. On the unrealized open positions, we reported a $12 million increase in mark to market on our cargo position, which was offset by a negative movement in paper position of $3 million. After accounting for other expenses, which mainly comprise general and administrative expenses, product services reported a net profit after tax of $6 million for Q2 and net asset value of $58 million as at the quarter end. As we mentioned in the previous quarters, the large mark to market valuation movement is due to the gradual phase in of our multiple year term contract, which reflects value adjustments in time of volatile market.

While the value is significant, it reflects the delta between the balance sheet dates, and we’ll continue to see fluctuations before the positions are realized. We also want to highlight that due to the nature of trading, its gain and loss are realized in different financial periods and cannot be extrapolated and predicted using its historical performance. Its unrealized position will fluctuate depending on the valuation at the end of the financial period, driving the accounting results up and down drastically. It’s important to remember that our trading model looks at creating value combining positions of cargoes, paper, and shipping positions.

As such, we would like to remind you that the reported net asset value does not include the unrealized physical shipping position of $10 million, which was based on our internal valuation. In light of the strong shipping market outlook, the open cargo contracts and hedging position may in turn experience negative mark to market valuation changes, and we’ll continue to see fluctuations before the positions are realized. In Q2, our average bar value at risk was $6 million, reflecting a well-balanced trading book of cargoes, shipping, and derivatives after including the increased term contract volume as mentioned. Going on to our financial highlights.

We reported a net profit after tax of $43 million, including a profit of $16 million from BW LPG India, a $6 million profit from product services. Profit attributable to equity holders of the company was $35 million for this quarter, which translates into an earnings per share of 23¢ and an annualized earning yield of 8% when compared against our share price at the June. We reported a net leverage ratio of 31% in Q2, a slight decrease from 33% reported end of last year. The decrease was due to lease liability reduction of $123 million from the purchase option exercised for BW Kisuku and BW Yushi, partly offset by the net drawdown of some banking facilities.

For Q2, the board declared a dividend of 22¢ per share, which translates to a 110% payout of our quarterly shipping profit. These are also supported by some of the retained dividends from product services in 2024. For the period end, our balance sheet reported a shareholders’ equity of $1.9 billion. The annualized return on equity and capital employed for Q2 were 98%, respectively. Our Q2 OpEx was $9,000 per day. For full year 2025, we estimate our own fleet’s operating cash breakeven per day to be $19,100 per day and total fleet’s operating cash breakeven, including time charter in vessels, to be $21,700 per day.

Please note, this is a reduction compared with the cash breakeven of 2024 of $22,800 per day, primarily due to meticulously managed financing, reduced time charter in vessels, and lower G&A per day. And this is also offset by increased OpEx. All in cash breakeven, including dry dock program, for the year is estimated to be $24,800. Next slide, please. On the liquidity side, at the end of Q2, we maintained a strong position of $7.8 billion, including $287 million in cash and $421 million in undrawn revolving credit facilities. Due to our meticulously managed financing plan, we are able to support our fleet growth and remain a robust and resilient financial position to weather the future.

Our repayment profile continues to be sustainable and healthy with major repayment only kicks in after February 19, 2029. On the product services side, trade finance utilization stood at a moderate level of $303 million or 38% of our available credit line, providing sufficient room for future trading needs. Okay. With that, I would like to conclude my update. Thank you for listening, and back to you, Aline.

Operator: Thank you, Samantha, and thank you, Kristian. We would now like to open the call for Q&A for questions. So please type your questions in the Q&A channel. You can also click the raise hand button to ask your questions verbally. Please note though that participants have been automatically muted, so please press unmute before speaking. We will start with the verbal questions first before then moving on to the chat. So please, if you want to ask a question, please raise your hand. I see first up Thomas Christiansen. Please unmute yourself.

Thomas Christiansen: Thank you. Can you hear me?

Operator: Yes.

Thomas Christiansen: That is really good. I have a question regarding the fleet growth. First of all, if you could that’s a factual question. Put some figures regarding the capacity of the VLGC fleet today and with the expected 111 vessels going forward. And then my next question is if that is a concern, this fleet growth to you? And if it is, how you will mitigate the impact? And if not, why it’s not a concern?

Kristian Sorensen: Thank you, Thomas. I can say I mean, it’s to go into detail of every vessel size. It’s probably going to take too long, but these ships are quite standardized, except that you have about is it 60 ships now of this fleet, which are Panamaxes, which can go both the old and the new canal lane with a capacity of 88,000 cubic meters. Otherwise, the VLGCs are relatively standard in their design. Some are 91,000, some are 93 and some are 88,000. Like I said, if you go back to the years before 2010, these ships are typically 82,000, maybe 84,000 cubes. So that’s kind of the way that the design has developed over the last ten years.

When it comes to the fleet growth in 2027, 2028, it’s something we’re absolutely not naive about. It should be viewed in the context of also more LPG volumes coming on stream, like mentioned, from the U.S. as well as the Middle East. I think the fleet growth is kind of the same picture we had going from 2022 into 2023, where the fleet growth was actually absorbed very well in the market because the inefficiencies and the volume expansion from the U.S. in particular absorbed the fleet capacity, which came on the water. But we are absolutely not naive about this.

And as previously mentioned, we also have a time charter portfolio, which is currently just above 30% of our capacity, which we are given provided the rates are found attractive, probably going to grow into towards 40%. So that’s the way we are protecting the downside as also mentioned in the beginning of our presentation.

Operator: Thomas, you had a follow-up question?

Thomas Christiansen: Oh, yes, I did. I mean, little bit in the same context. I mean, recently, Panama announced that it wouldn’t register the ships above fifteen years. I mean, you say on a global level, how does that impact the fleet of big gas carriers? And also, does would that impact the BW LPG’s business?

Kristian Sorensen: Sorry. I didn’t get that. That the Panama Canal has?

Thomas Christiansen: No. The Panama register, the flag register Panama, announced that it will not register ships above fifteen years going forward. How that how does that impact the global market and your market?

Kristian Sorensen: Well, then there will be fewer ships going through the Panama Canal, and I guess more ships have to sail around South Africa if to and from Asia and the U.S., if that is the case.

Thomas Christiansen: I think it’s more I think it’s more about, to register, to be to be to flag the Panama flag going forward that the

Samantha Xu: Hello?

Kristian Sorensen: Thomas, you disappeared.

Operator: Yeah. It looks like we lost him.

Kristian Sorensen: Thomas, are you with us?

Thomas Christiansen: Can you hear me now? Yes.

Kristian Sorensen: Yeah. We can.

Thomas Christiansen: Okay. Sorry. Yeah. It’s no. I think it’s more about it’s the register, the flag register, Panama’s flag register that one doesn’t want to allow, vessels above fifteen years to be registered, with Panama Flak going forward. So I guess that somehow will exclude some vessels from the global fleet of big gas carriers. So if you have a view on how that will impact the global fleet and your business too.

Kristian Sorensen: I think the I’m not sure about the restrictions on flagging ships in Panama. But if that is the case, I presume that there are all the registers where you can flag your ships. So it’s nothing which will have a commercial impact on our markets as far as I can see.

Thomas Christiansen: Alright. Thank you.

Operator: Thank Next up was Climent Molins. Please go ahead.

Climent Molins: Hi, good afternoon, and thank you for taking my questions. Over the years, you’ve generated significant shareholder value by exercising the purchase options at well below market prices on time charter team vessels with the Yuchi as the most recent example. Could you remind us whether you have purchase options on any of your remaining time charter in vessels?

Kristian Sorensen: We do have on one ship later in the decade, but there are no purchase options in the immediate future to say to phrase it that way. But we do have some towards the end of the decade.

Climent Molins: Okay, makes sense. Q3 guidance was a bit, let’s say, disappointing maybe relative to recent market trends, especially on the spot market. A portion of that is attributable to your time charter book. But could you please delve a bit into the numbers? Where a significant portion of days fixed before rates went up?

Kristian Sorensen: That’s something we will have to get back to you on for the next quarter because that’s that requires a bit of meticulous working to get that number correct. But you’re absolutely right that the time charter portfolio, which protected our downside in the second quarter is also affecting the number we’re guiding on for the third quarter. And also keep in mind that we do have dry dockings taking place throughout this year. And there is also a position and timing effect here, which is important to keep in mind because these voyages are usually three months voyages.

And to have ships in position for the uptick in the rates takes time to before you see ships are load ready and can actually benefit from the strength in the market. So I think we have to get back to you on the details on the split between spots and time charter like we typically do in our earnings presentation.

Climent Molins: Makes sense. Thank you for the color anyway. And final question from me. You had 139 dry docking days in Q2 followed by 143 and 135 in Q3 and Q4 respectively. How many vessels are expected to go through drydocking each quarter? And secondly, have you seen any congestion going into drydocks?

Kristian Sorensen: No congestions, but it’s another six, seven ships for the remainder of this year.

Climent Molins: Thank you. That’s all from me. I’ll turn it over.

Kristian Sorensen: Thank you.

Operator: Thank you, Climent. We have, John Dixon next.

John Dixon: Good morning, Kristian. Good morning, Samantha. I just have a real quick question for you related to the Panama Canal. We saw earlier this year like, just you can hear me. Right?

Samantha Xu: Yeah. I can hear you well, John.

John Dixon: Oh, okay. Earlier this year, President Trump here in the United States has really spent a lot of time with Panama trying to get the freight rates down for US flag vessels. Is that and US naval vessels, of course. Is that something that you see that’s impacting the congestion in the Panama Canal? And do you kind of expect to see that going forward?

Kristian Sorensen: Not really. The capacity is mainly being absorbed by container ships. We see more ethane carriers on the back of the increased exports of ethane from the U.S. And this is going to accelerate in coming years as well as other ship types. But we don’t so far see any impact from the, let’s say, naval ships or the U.S. flagships as you mentioned.

John Dixon: Okay. Thank you very much. That was my only question.

Operator: Thank you, John. Do we have any more questions that you would like to ask verbally before we move on to the chat? If not right now, we might just turn to the chat, maybe starting with Andreas first. SGA has come down from Q4 and also Q1. What is driving this? And is the current level a more realistic level going forward?

Kristian Sorensen: Samantha, I guess this one is for you. On the G and A side, what typically drives this up? I presume this is the G and A we are referring to. Right?

Samantha Xu: I assume the SGA refers to the G and A. Yeah. From this and the current level is more or less. Yeah. I think, Andreas, so GNA is not something that we can how to say how to say we can give you a good base for you to estimate because partly of that is the shipping’s journey and the other part is product services journey, which is a reflection of the realized profit as part of the incentive scheme. So that’s why it would you will see fluctuations of a G and A as a true up reflecting that the product services are realized profit as well.

Operator: Alright. Anders had another question related to spot rates being lower. So the question was, with the current market dynamics being favorably and comparing relative to peers reporting recently, what is the reason for the achieved spot rates for Q3 being relatively lower for BW LPG Limited?

Kristian Sorensen: Yeah, I think well, it’s not I guess, our peers have to answer for their numbers themselves. But at least for us, when we guide on the Q3 numbers, it’s including both spot and the time charter portfolio. So it’s not pure spot. And as mentioned also to Climent earlier is that the time charter portfolio is affecting this number compared to the pure spot rate that you see in the markets. And of course, have the positioning, the timing effects and the fact that we also have a relatively busy drydocking agenda and scheme this year, which will impact guiding and the results going forward.

Operator: Thank you. We move on to a question from Peter on VLACs. To what extent are the VLACs affecting the VLGC market? And when do you expect to start seeing some scrapping?

Kristian Sorensen: The VLACs are currently, you know, as they are being phased in, you know, these are basically going to trade as far as we can see as regular VLGCs because the ammonia trade for these kind of vessels hasn’t materialized yet and has probably not gone materialize before we are well into the 2030s as it looks now. So we regard them as part of the, let’s say, conventional VLGC fleet in our market outlooks. And then there was another question, which was whether we start seeing some scrapping. Scrapping is typically taking place when the markets are really, really low.

These ships, when they go out, let’s say, the conventional trade, they’re typically when they reach, at least 25 years, they end up in captive trade, floating storage operations. And technically, these ships can last, you know, until they are 40 years of age basically, because there is very little wear and tear compared to a dry cargo ship, for instance. So we I don’t anticipate to see any scrapping activity picking up before the markets are at a very different level than what we see today.

Operator: Thank you, Kristian. We have another question in the chat from Olaf on contract extension. Do you have any plans to extend the contracts for the vessels you’re currently chartering in?

Kristian Sorensen: This is something we will decide on as we get closer to the expiry of these various contracts. So we will inform the market more on how we extend or choose not to extend these contracts as we move into the third and the fourth quarter.

Operator: Thank you. Another question from Greg on ton mile upside. Regarding ton mile upside from U.S.-China trade tensions, you mentioned that voyage patterns are reverting. Can you quantify in general terms how much of the tonne mile upside is still here still there today? Is it mostly still there or mostly gone?

Kristian Sorensen: This is a very good question, Greg. What we do see is that U.S. cargo flows into China have kind of returned to a certain extent. But the surge in U.S. cargoes heading into India has come off. So I think it’s it’s a bit too early to see whether there is actually a new trade pattern established between the U.S. and India, for instance, or if this was just a one off. So it’s hard to kind of quantify this. But as mentioned, we saw more than 1 million tons heading from the U.S. into India in the second quarter against less than 100,000 tonnes for the entire 2024.

But the and also a side effect of this, which is quite interesting, which we probably underestimated was that India, which over the last years has absorbed basically 50% of all the LPG exports from the Middle East was suddenly receiving less cargoes from the Middle East because the Middle East sent more cargoes all the way to China. So we need a bit more time, I think, to quantify these ton mile effects and how it really impacted the market.

Operator: Thank you. We have a question from Axel Styrman on Ethene. Do you have any comments to the optionality on Ethene LPG exports from the U.S. Gulf in 2025 and in 2026. Which share of Ethene LPG do you expect to be shipped from the expansions where there is such optionality?

Kristian Sorensen: Thanks, Axel. So we understand that from the Netherlands terminal, for instance, they will start up with LPG and then phase in the ethane as we get into 2026. We assess kind of we have a fifty-fifty split on that one. Enterprise, they have two expansions where one of them will eventually be ethane only. So I think there is good reasons to believe that, you know, a substantial part of the terminal expansion for energy transfer as well as enterprise will be designated for ethane capacity.

Operator: We have another question in the chat from Chandan on Panama Canal congestion. So he would like to know what is driving the containership congestion increase in Panama Canal. What do you think?

Kristian Sorensen: I’m not sitting close enough to the container market to give a kind of a qualified reply on this, but I suspect that it has something to do with the ongoing trade war, negotiations between China and the U.S. But the container traffic in and around the canal is steadily growing simply because also there are more ships in general on the water fighting for this very limited capacity, which the Panama Canal has to offer.

Operator: And final question for now in the chat before we can open up again, verbally as well is from John on the spot rates level. How do you look at the current freight market for VLGCs? Are spot rates of $70,000 a day a sustainable level, or do you feel there are some downside risk in the near to medium term? And how do you look at the traffic in Panama Canal, especially for containers into the second half of 2025?

Kristian Sorensen: Good questions. I think there is always a downside risk when you are at $70,000 per day in the market. But we do see also today, for instance, that ships are being booked around that level. So it seems like the market is able to absorb it and that the rates are sustainable. But I wouldn’t say that there is not any downside risk to this rate level. But we believe that the Panama Canal is definitely playing a vital role in driving these rates further up or down. The fundamentals are solid. So it’s not like we have changed any views on the fundamentals of the market. But the wildcard is the Panama Canal.

And as mentioned, we see the containers are taking up substantial and increasing part of that capacity over the last couple of weeks. So it seems like the situation, even though it’s it’s rapidly changing from one week to the other, it seems like the Panama Canal congestion is going to be playing a role in the market in our market going forward. I think that seems to be the case.

Operator: Thank you, Kristian. There’s no more questions in the chat right now, but we have John Dixon who raised his hand again. So please, if you wanna go ahead, John.

John Dixon: Kristian, just real quick. Looking to the fourth quarter, Samantha said and you all showed that you’ve you’ve booked about 30% of your available days into the fourth quarter. Obviously, the way I’m looking at that is that if those freight rates stay higher leading into the fourth quarter, I’m assuming that is gonna be reflected. I mean, obviously, you still have a lot of available days left to book. Is that kind of the way you guys are looking at it? Or what’s your perspective leading into that fourth quarter?

Kristian Sorensen: I think, John, the way to look at this is that regardless of how the market is performing the spot market is performing, we have this 30 odd percent of all the fleet capacity locked in at $45,000 per day thereabout. And this will obviously have an impact on our time charter equivalent for an income for that quarter. But the remaining 70%, are exposed to the spot market. So that’s something we are happy to keep for time being at least, if that kind of answered your question.

John Dixon: It does, Kristian. Thank you. I and I appreciate it.

Operator: Thank you, John. Do we have any more questions? Either you wanna type it into the chat or raise your hand. We still have a couple of minutes left. Alright. If not, Kristian, you wanna provide a few closing remarks?

Kristian Sorensen: Then I think it’s time to round it off and say thanks to everyone listening in and for asking good questions. And we look forward to seeing you again in November. And in the meantime, we look forward to an exciting market development in the months to come. Thank you, everyone.

Operator: Thank you, Kristian. Thank you, Samantha. This will conclude our call. The call transcript and recording will be available on our website shortly. So thanks a lot for dialing in, and we wish you a very good rest of your day.


Source link

Best Sub-Custodian Banks in Western Europe for 2025

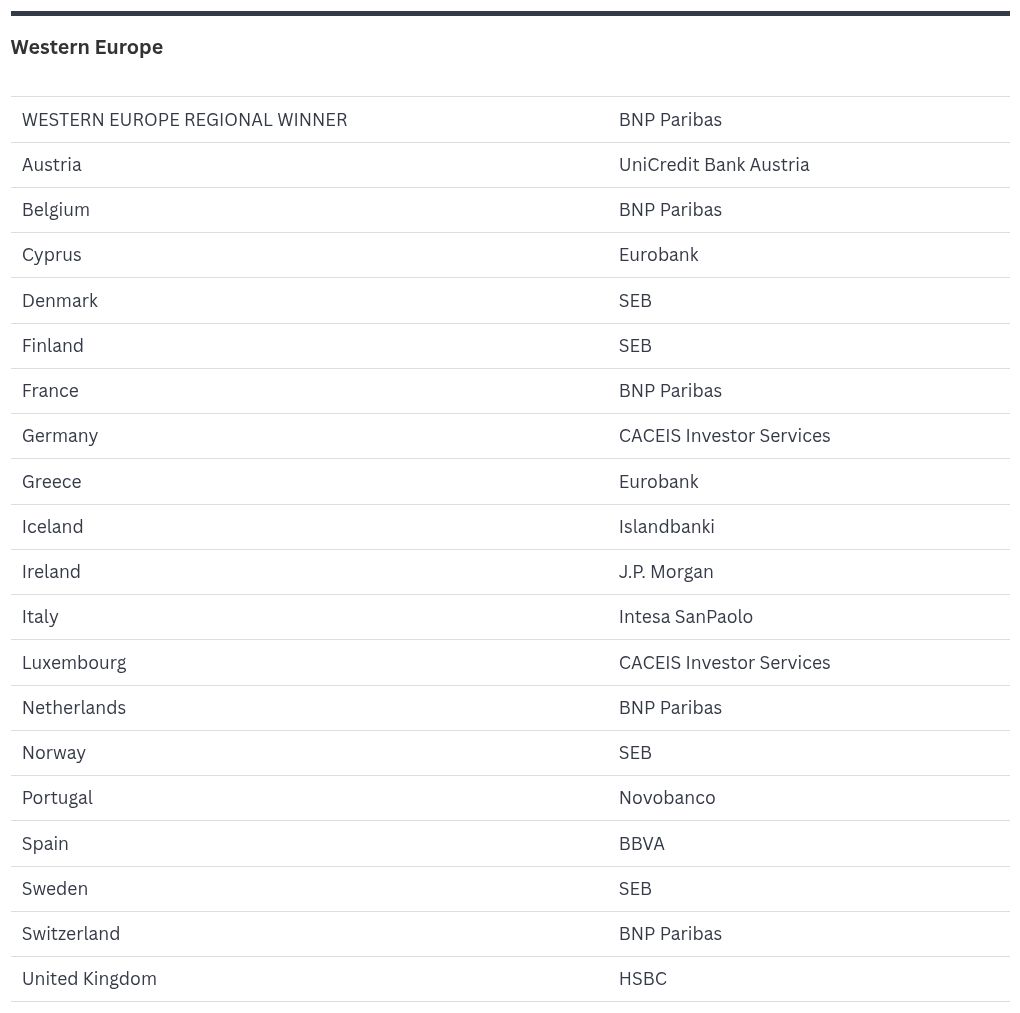
BNP Paribas continues to build on its exceptional securities-services franchise through internal initiatives and partnerships that leverage technology for growth across its platform. With this progress, the bank is recognized as our regional winner for Western Europe. In the region, BNP Paribas is also our country winner in Belgium, France, the Netherlands, and Switzerland.

One of the bank’s service initiatives includes the development of open architecture strategy designed to integrate client-portfolio management systems with the bank’s middle- and back-office services. The offering enables direct and standardized data connectivity between BNP’s global fund-accounting systems and Bloomberg Asset and Investment Manager. This connectivity delivers greater transparency along the transaction lifecycle, with real-time post-trade workflows and faster data availability.

In addition, the bank launched a new post-trade data-management service using offerings from financial data technology provider NeoXam. This provides greater transparency, allowing clients to view securities portfolios across different asset classes and includes performance and risk analytics as well as reporting features.

At the same time, BNP clients benefit from the bank’s NeoLink digital custody platform that delivers a complete, simple, and customizable range of services. BNP recently enhanced the system’s reporting capabilities, allowing users to manage data and reports. The bank has also expanded its centralized booking model, enabling clients to engage with a single legal entity in the Paris office for services across multiple markets, with access to seven European CSDs.

Under this structure, client accounts are segregated based on the market but are linked to a single cash account for efficient settlement. In every country BNP serves, it works with regulators on market developments to both advance the custody infrastructure and advocate for clients in these jurisdictions. With the move to a T+1 settlement cycle in the EU, BNP is committed to a seamless transition for the industry and the bank’s clients by serving as an active member of the EU industry task force on T+1 implementation.

Methodology

In selecting the institutions that reliably provide the best services in these local markets and regions, Global Finance’s editorial board considered market research, input from expert sources, and entry information from the banks themselves. The criteria included such factors as customer relations, quality of service, technology platforms, and post-settlement operations, as well as knowledge of local markets, regulations, and practices.

table visualization

Source link

Thinking of Buying the Trade Desk Stock? Here Are 2 Risks to Consider.

The Trade Desk faces risks that could impact its long-term growth.

The Trade Desk (TTD 0.81%) is one of the most closely watched companies in the advertising technology space. Its platform helps brands and agencies buy digital ads across various channels, including connected TV (CTV), audio, display, and mobile. The company has built a reputation as a disruptor, benefiting from the secular shift away from traditional linear TV and the move toward more automated, data-driven ad buying.

However, even great companies face risks, and investors should carefully weigh these before investing. In The Trade Desk’s case, two stand out: ongoing operational challenges that could slow growth, and a valuation that leaves little room for error.

A young person working on her phone.

Image source: Getty Images.

The Trade Desk faces risks that could impact its long-term growth

On the surface, The Trade Desk looks unstoppable. It continues to win share as advertisers reallocate budgets from traditional channels toward digital and CTV. However, beneath that momentum, the company is facing a few operational hurdles.

The biggest one involves its UID2 identity solution. With third-party cookies being phased out by Google in 2025, The Trade Desk has promoted UID2 as an industry standard to enable targeted advertising while preserving user privacy. Adoption has been broad and partners such as Walt Disney, Fox, Roku, and many publishers have integrated UID2. Still, it’s far from guaranteed that UID2 will emerge as the universal replacement. Google has its own Privacy Sandbox framework, and other walled gardens, such as Apple, are unlikely to adopt UID2.

This means The Trade Desk’s future growth in open-internet advertising depends heavily on how well UID2 gains traction versus rival identity solutions. If adoption slows or if regulators impose stricter privacy rules, the company’s targeting capabilities — and therefore its value proposition to advertisers — could weaken.

Another challenge is the competitive intensity in connected TV. While CTV is The Trade Desk’s fastest-growing segment, competition is intensifying as streamers like Netflix, Amazon, and Disney ramp up their advertising businesses. These platforms are building in-house tech and are under pressure to maximize revenue per user, which could limit the scale of inventory they make available through third-party demand-side platforms like The Trade Desk. In other words, if major streamers decide to keep more ad buying within their ecosystems, The Trade Desk’s CTV runway could narrow.

Internally, the company is undergoing one of the most significant adjustments with significant changes in the senior management team. For example, in the second quarter of 2025 alone , it saw the hiring of a new CFO and a new board member with expertise in data, AI, and advertising. Managing this transition while scaling the business is not an easy task.

Together, these operational challenges may derail The Trade Desk from its historically high growth trajectory.

The stock price isn’t a bargain despite the uncertainties ahead

The second red flag that investors need to consider is valuation. Even after a sharp pullback in recent months, The Trade Desk trades at approximately 63 times earnings and nearly 10 times sales. That’s an expensive price tag for a company operating in a cyclical industry where growth depends on macro ad spending trends.

To be fair, The Trade Desk has earned its premium multiple. It has consistently grown its revenue , maintained profitability, and adjusted its strategies as the industry has developed — introducing platforms such as Kokai AI, UID2, and others.

Additionally, it operates in an industry with a global total addressable market (TAM) of nearly $1 trillion . Within this industry, connected TV (CTV) is one of the fastest-growing segments — an area where the company has invested heavily over the years to capitalize on the tailwind.

But here’s the thing. Even if The Trade Desk continues to march ahead, sustaining its current valuation requires near-flawless execution. Any stumble — whether slower UID2 adoption, increased competition in CTV, or a cyclical ad slowdown — could trigger a sharp contraction in multiple.

That’s the risk of buying in at a premium: The business can do well, but the stock may not if expectations are too high.

What does it mean for investors?

The Trade Desk has undeniable strengths: It’s founder-led and well-positioned for the secular shift toward programmatic advertising.

However, it’s essential to balance the bullish case with the risks. Operational challenges around identity and CTV competition could complicate execution. And with the stock still trading at a steep valuation, investors aren’t getting much of a discount for taking on that uncertainty.

If you’re considering buying The Trade Desk stock today, the prudent move may be to wait for a better entry point or clearer signs of UID2’s industry dominance before committing your hard-earned capital.

Lawrence Nga has no position in any of the stocks mentioned. The Motley Fool has positions in and recommends Amazon, Netflix, Roku, The Trade Desk, and Walt Disney. The Motley Fool has a disclosure policy.

Source link

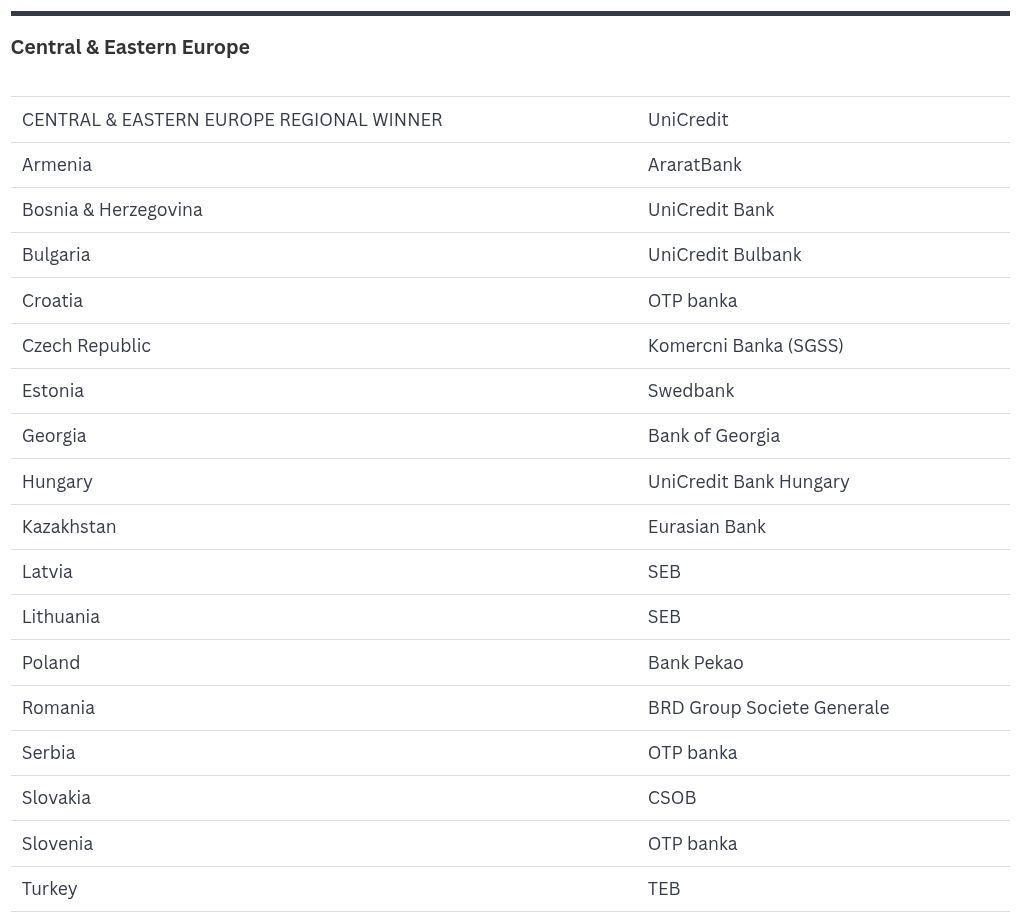
Best Sub-Custodian Banks in Central and Eastern Europe for 2025

UniCredit continues to demonstrate industry leadership in Central and Eastern Europe (CEE) through an extensive franchise that offers comprehensive services and deep local-market knowledge. The bank’s client-centric approach emphasizes tailored post-trade solutions, process efficiency through high levels of automation, strong operational risk management, and market advocacy to address new regulations. With this approach, the bank is building on its strong position in each of its markets, experiencing consistent growth in assets under custody, revenue from existing customers, and new client mandates. Reflecting this progress, UniCredit is also the country winner in Bosnia and Herzegovina, Bulgaria, and Hungary.

Julia B. Romhanyi, Global Head of Securities Services, UniCredit

A key element of the bank’s success lies in its service model. Across UniCredit’s franchise, it offers two service options: The bank’s direct-servicing model provides market access and transaction execution in its 10 CEE markets. With the bank’s hub and spoke model in Austria, clients benefit from a single counterparty relationship for efficiencies with documentation and due diligence, as well as a dedicated relationship manager.

Ongoing technology advancement involves upgrading UniCredit’s TCS BaNCS custody system in eight markets, and launching a data-aggregation platform for greater access throughout the franchise to improve services addressing changes in local regulatory landscapes. Improving efficiency is one of the most critical components of the post-trade process. UniCredit has made enhancements in straight-through processing of transactions. These enhancements leverage automation and artificial intelligence (AI) to streamline workflows, reducing manual intervention and errors, for faster processing and improved client service.

Additionally, the bank is developing more-effective digital client platforms to provide real-time access to portfolio transactions, with analytics and custom reporting. With UniCredit’s extensive tenure and expertise in the region, it is an advocate for its clients on regulatory and market developments. The bank is also a powerful resource for peers and regulators across its franchise and has contributed to advancements and efficiencies with the market infrastructure in areas including reduced settlement cycles, taxation, corporate actions, and proxy voting.

Methodology

In selecting the institutions that reliably provide the best services in these local markets and regions, Global Finance’s editorial board considered market research, input from expert sources, and entry information from the banks themselves. The criteria included such factors as customer relations, quality of service, technology platforms, and post-settlement operations, as well as knowledge of local markets, regulations, and practices.

table visualization

Source link

Nissan shares plummet more than 6% as Mercedes-Benz sells its stake

Published on 26/08/2025 – 12:50 GMT+2
Updated
12:52


ADVERTISEMENT

Struggling Japanese carmaker Nissan Motor Co. saw its shares sink by more than 6% in Tokyo on Tuesday after the company’s second-biggest shareholder, Mercedes-Benz, announced that its pension fund was selling its entire 3.8% stake.

Mercedes’ withdrawal comes as Nissan is implementing a restructuring plan, designed to reduce costs and improve profitability. The Japanese car producer reported a net loss of ¥670.9bn (€3.91bn) for the year that ended in March, and it was followed by a quarterly net loss of ¥115.8bn (€674mn) for the April-June quarter. 

Nissan suspended its financial guidance for the year and announced a restructuring plan, which includes cutting 20,000 jobs and closing factories.

Shareholders haven’t shown much confidence so far in the plans. Nissan stock has lost more than 28% of its value in the year to date, sending the company’s market capitalisation below €7.4bn.

The stocks briefly rose after US President Donald Trump said in July that he would lower tariffs on Japanese car imports to 15%, but the momentum was short-lived.

A spokesperson from Mercedes-Benz said in an email that Nissan shares, that have been held in pension assets since 2016, were “not of strategic importance”.

Nissan’s long-term allies include the French carmaker Renault, which bailed out the Japanese company in 1999 and gained 37% ownership. This was later increased to around 43%, although Nissan has gradually been reducing its holding.

Source link

Gold Reserve Provides Update on CITGO Sale Process

Article content

PEMBROKE, Bermuda — Gold Reserve Ltd. (TSX.V: GRZ) (BSX: GRZ.BH) (OTCQX: GDRZF) (“Gold Reserve” or the “Company”) announces that, pursuant to the schedule set by the U.S. District Court for the District of Delaware (the “Court”), the Special Master provided a Notice of Determination of Superior Proposal (“Notice”) to the Company on August 25, 2025. The Notice refers to an Unsolicited Competing Proposal submitted by Amber Energy Inc. to the Special Master on August 22, 2025, that the Special Master determined constituted a “Superior Proposal” under the terms of the Stock Purchase Agreement the Company executed with the Special Master on June 25, 2025.

Article content

Article content

The Court has set an August 27, 2025 deadline by which the Company may file a motion to strike or otherwise object to the Notice. Argument on any such motion will be heard by the Court at the rescheduled Sale Hearing commencing September 15, 2025.

Article content

Article content

Article content

The Notice refers to the Amber Energy bid including, in part, the following:

Article content

“(ii) an additional amount of consideration that would be used (A) to satisfy a portion of the Attached Judgment of Gold Reserve Ltd., f/k/a Gold Reserve Inc. (“Gold Reserve”), or (B) if Gold Reserve declines such proposed consideration, towards satisfaction of other Additional Judgment Creditors as determined by the Special Master in consultation with Amber Energy or as otherwise directed by the Court (the “Additional Consideration”)

Article content

Article content

The Company cautions that this “additional amount of consideration” is, in the Company’s view, de minimis in comparison to the total value of the Company’s Attached Judgment and, as stated in the Notice, may not result in the Company recovering any amount on its Attached Judgment.

Article content

The Notice further states:

Article content

Article content

PLEASE TAKE FURTHER NOTICE THAT

Article content

, pursuant to section 6.16(d) of the Dalinar SPA, the Special Master has determined in good faith that the Amber August 22 Bid constitutes a Superior Proposal (as defined in the Dalinar SPA) and has provided written notice of this determination, together with the required bid materials, to Dalinar. Pursuant to the Scheduling Order dated August 22, 2025 (D.I. 2110) and section 6.16(d) of the Dalinar SPA, Dalinar has three (3) business days from receipt of such written notice (i.e., until August 28, 2025) to submit to the Special Master any revisions to the Dalinar SPA and the transaction contemplated thereby, if Dalinar elects to do so, which revisions the Special Master will consider in good faith in accordance with the terms of the Dalinar SPA.

Article content

Article content

A copy of the Special Master’s Notice will be posted here.

Article content

A complete description of the Delaware sale proceedings can be found on the Public Access to Court Electronic Records system in Crystallex International Corporation v. Bolivarian Republic of Venezuela, 1:17-mc-00151-LPS (D. Del.) and its related proceedings.

Article content

Cautionary Statement Regarding Forward-Looking statements

Article content

This release contains “forward-looking statements” within the meaning of applicable U.S. federal securities laws and “forward-looking information” within the meaning of applicable Canadian provincial and territorial securities laws and state Gold Reserve’s and its management’s intentions, hopes, beliefs, expectations or predictions for the future. Forward-looking statements are necessarily based upon a number of estimates and assumptions that, while considered reasonable by management at this time, are inherently subject to significant business, economic and competitive uncertainties and contingencies. They are frequently characterized by words such as “anticipates”, “plan”, “continue”, “expect”, “project”, “intend”, “believe”, “anticipate”, “estimate”, “may”, “will”, “potential”, “proposed”, “positioned” and other similar words, or statements that certain events or conditions “may” or “will” occur. Forward-looking statements contained in this press release include, but are not limited to, statements relating to any bid submitted by the Company for the purchase of the PDVH shares (the “Bid”).

Article content

Article content

We caution that such forward-looking statements involve known and unknown risks, uncertainties and other risks that may cause the actual events, outcomes or results of Gold Reserve to be materially different from our estimated outcomes, results, performance, or achievements expressed or implied by those forward-looking statements, including but not limited to: the discretion of the Special Master to consider the Bid, to enter into any discussions or negotiation with respect thereto; the Special Master may not recommend the Bid in the Final Recommendation; an objection to the Bid may be upheld by the Court; the Bid will not be approved by the Court as the “Final Recommend Bid” under the Bidding Procedures, and if approved by the Court may not close, including as a result of not obtaining necessary regulatory approvals, including but not limited to any necessary approvals from the U.S. Office of Foreign Asset Control (“OFAC”), the U.S. Committee on Foreign Investment in the United States, the U.S. Federal Trade Commission or the TSX Venture Exchange; failure of the Company or any other party to obtain sufficient equity and/or debt financing or any required shareholders approvals for, or satisfy other conditions to effect, any transaction resulting from the Bid; that the Company may forfeit any cash amount deposit made due to failing to complete the Bid or otherwise; that the making of the Bid or any transaction resulting therefrom may involve unexpected costs, liabilities or delays; that, prior to or as a result of the completion of any transaction contemplated by the Bid, the business of the Company may experience significant disruptions due to transaction related uncertainty, industry conditions, tariff wars or other factors; the ability to enforce the writ of attachment granted to the Company; the timing set for various reports and/or other matters with respect to the Sale Process may not be met; the ability of the Company to otherwise participate in the Sale Process (and related costs associated therewith

Article content

Article content

; the amount, if any, of proceeds associated with the Sale Process; the competing claims of other creditors of Venezuela, PDVSA and the Company, including any interest on such creditors’ judgements and any priority afforded thereto; uncertainties with respect to possible settlements between Venezuela and other creditors and the impact of any such settlements on the amount of funds that may be available under the Sale Process; and the proceeds from the Sale Process may not be sufficient to satisfy the amounts outstanding under the Company’s September 2014 arbitral award and/or corresponding November 15, 2015 U.S. judgement in full; and the ramifications of bankruptcy with respect to the Sale Process and/or the Company’s claims, including as a result of the priority of other claims. This list is not exhaustive of the factors that may affect any of the Company’s forward-looking statements. For a more detailed discussion of the risk factors affecting the Company’s business, see the Company’s Management’s Discussion & Analysis for the year ended December 31, 2024 and other reports that have been filed on SEDAR+ and are available under the Company’s profile at www.sedarplus.ca.

Source link

If You’d Invested $1,000 in Vanguard Real Estate ETF (VNQ) 5 Years Ago, Here’s How Much You’d Have Today

The real estate sector has underperformed the S&P 500 in recent years, and by a wide margin.

I won’t keep you in suspense. If you had invested $1,000 in the Vanguard Real Estate ETF (VNQ -0.51%) a decade ago, you would have about $1,770 today, assuming you reinvested your dividends along the way.

This isn’t a terrible outcome. After all, you wouldn’t have lost money. But when you consider that $1,000 invested in an S&P 500 index fund such as the Vanguard S&P 500 ETF (VOO -0.37%) 10 years ago would be worth $3,900, it doesn’t exactly look like stellar performance.

Woman looking at monitor with frustrated expression.

Image source: Getty Images.

What went wrong?

The short version is that the real estate sector underperformed the S&P 500 because, first, the S&P 500 has been on an incredible bull run. It has produced annualized total returns of about 14.6% over the past decade, making it touch to beat.

In addition, real estate is perhaps the most rate-sensitive sector of the market. Over the past 10 years, we’ve seen two prolonged periods of Federal Reserve rate increases, with a global pandemic in between. In fact, the benchmark federal funds rate is more than 400 basis points higher than it was a decade ago.

Real estate investment trusts (REITs) have a strong history of outperforming the market in falling rate or zero-rate environments but underperforming when rates are high or rising.

Without turning this into an economics lesson, there are a few reasons REITs are so sensitive to interest rates. One is borrowing costs. REITs tend to rely heavily on borrowed money to grow, similar to how you might rely on a mortgage to buy a home. Rising rates make the economics of borrowing less favorable.

In addition, rising rates put pressure on commercial real estate property values, which tend to have an inverse relationship with risk-free interest rates (those offered by Treasury securities). The properties REITs own can literally be worth less simply because rates went higher.

On the other hand, it’s worth noting that these things can also become real estate’s biggest catalysts in a falling-rate environment.

Matt Frankel has positions in Vanguard Real Estate ETF and Vanguard S&P 500 ETF. The Motley Fool has positions in and recommends Vanguard Real Estate ETF and Vanguard S&P 500 ETF. The Motley Fool has a disclosure policy.

Source link

This Popular Artificial Intelligence (AI) Stock Could Plunge More Than 70%, According to 1 Wall Street Analyst

Wall Street analysts tend to be a decidedly optimistic bunch. Of the 503 stocks in the S&P 500 (^GSPC -0.43%) (there are more than 500 because some companies have multiple share classes), analysts rate 409 as buys or strong buys. As you might imagine, the artificial intelligence (AI) stocks that have propelled the market higher in recent years are among Wall Street’s favorites.

However, this bullishness has its limits. There’s an especially popular AI stock among retail investors that could plunge 70% or more, according to one Wall Street analyst.

A person giving a thumbs down.

Image source: Getty Images.

An AI favorite

The stock I’m referring to is Palantir Technologies (PLTR -0.98%), which been one of the hottest stocks on the market. Palantir has skyrocketed more than 23x since the beginning of 2023.

Sure, Palantir’s shares have pulled back by a double-digit percentage from its recent high. However, the stock has still roughly doubled year to date. That’s enough to rank Palantir as the best-performing member of the S&P 500.

The excitement about Palantir stems primarily from the growing demand for its products. The company makes software for analysis, pattern detection, and AI-assisted decision-making. In the second quarter of 2025, Palantir’s revenue jumped 48% year over year, and the company projects next quarter’s revenue growth will be even higher.

Palantir CEO Alex Karp wrote to shareholders earlier this month, “For a start-up, even one only a thousandth of our size, this growth rate would be striking, the talk of the town.” He added, “For a business of our scale, however, it is, we continue to believe, nearly without precedent or comparison.” Karp thinks, “This is still only the beginning of something much larger and, we believe, even more significant.”

The biggest Palantir bear on Wall Street

One analyst isn’t on the Palantir bandwagon, though. RBC Capital‘s Rishi Jaluria is the biggest Palantir bear on Wall Street. His 12-month price target for the stock is a little over 70% below the AI software company’s current share price, and that’s after Jaluria raised his price target from $40 to $45 earlier this month.

Before Palantir’s Q2 update, Jaluria wrote to investors that Palantir’s “valuation seems unsustainable.” Even after Palantir’s strong earnings results, Jaluria pointed to the stock’s “unfavorable risk-reward profile.”

Several Wall Street analysts are concerned about Palantir’s valuation with its sky-high forward price-to-earnings ratio (P/E) of 250. Three others, in addition to Jaluria, rated the stock as an underperform or sell in a survey of analysts conducted by LSEG in August. Another 17 analysts recommended holding the stock, with only four rating Palantir as a buy or strong buy.

However, Jaluria is much more negative about Palantir stock than his peers. The average 12-month price target for Palantir is only slightly below the current share price.

Jaluria isn’t bearish about every AI stock, though. The RBC analyst thinks some companies will be bigger winners than others as AI adoption increases. He has especially singled out software leaders, including Microsoft and Intuit, as good picks.

Could Palantir really plunge more than 70%?

Could RBC’s Jaluria be right that Palantir’s share price could plunge more than 70%? Maybe. However, I suspect that his low price target is overly pessimistic.

Don’t get me wrong — I agree with Jaluria and other analysts who view Palantir as overpriced. The company’s growth prospects — even though they’re impressive — don’t justify its stock valuation, in my opinion. I think Jefferies analyst Brent Thill is correct in stating that Palantir’s premium multiple is “disconnected from even optimistic growth scenarios.”

I suspect that we could see Palantir’s share price fall well below the current level over the next 12 months. But I doubt that Palantir’s share price will fall nearly as much as Jaluria predicts.

Mizuho analyst Gregg Moskowitz recently argued that Palantir’s “uniqueness demands substantial credit,” pointing to the company’s ability to profit from AI, government digitization, and other trends. If he’s right (and I think he is), it means that Palantir could have a higher floor than the stock’s biggest Wall Street bears project.

Keith Speights has positions in Microsoft. The Motley Fool has positions in and recommends Intuit, Jefferies Financial Group, Microsoft, and Palantir Technologies. The Motley Fool recommends the following options: long January 2026 $395 calls on Microsoft and short January 2026 $405 calls on Microsoft. The Motley Fool has a disclosure policy.

Source link

Warren Buffett Just Bought 12 Dividend Stocks. Here’s the Best of the Bunch for Income Investors.

Income investors should especially like one of the stocks Buffett bought in the second quarter.

Warren Buffett has led Berkshire Hathaway for six decades. During that time, the one-time textile manufacturer that became a huge conglomerate never paid a dividend. Not even a penny.

However, Buffett loves dividend stocks. He bought 12 stocks in the second quarter of 2025. All of them pay dividends. Which is the best of the bunch for income investors?

Warren Buffett with people in the background.

Image source: The Motley Fool.

Buffett’s dozen dividend stocks

The following table lists Buffett’s dozen dividend stocks purchased in Q2 (listed alphabetically):

Stock Dividend Yield
Allegion (NYSE: ALLE) 1.20%
Chevron (CVX 0.03%) 4.34%
Constellation Brands (NYSE: STZ) 2.52%
Domino’s Pizza (NASDAQ: DPZ) 1.51%
D.R. Horton (NYSE: DHI) 0.94%
Heico (HEI -1.32%) 0.08%
Lamar Advertising (LAMR -0.92%) 4.95%
Lennar Class A (LEN -0.70%) 1.48%
Lennar Class B (LEN.B) 1.55%
Nucor(NYSE: NUE) 1.47%
Pool Corp.(NASDAQ: POOL) 1.56%
UnitedHealth Group(UNH -0.68%) 2.90%

Data sources: Berkshire Hathaway 13F filings, Google Finance.

Half of these stocks were new additions to Berkshire’s portfolio. Buffett bought more than 5 million shares of UnitedHealth Group in Q2, the biggest purchase of the group. The legendary investor probably viewed the health insurance stock as a rare bargain in today’s market after UnitedHealth’s share price plunged roughly 50%.

You might have noticed two similarly named stocks on the list. Homebuilder Lennar has two share classes. Buffett initiated a new position in Lennar Class A and added to the existing stake in Lennar Class B. Other new stocks bought in Q2 were security-products maker Allegion, homebuilder D.R. Horton, outdoor advertising company Lamar Advertising, and steelmaker Nucor.

Buffett also added more shares of several existing holdings. He has owned a sizable position in Chevron since 2020. The “Oracle of Omaha” (or one of Berkshire’s two other investment managers) has built stakes in Constellation Brands, Domino’s Pizza, Heico, Pool, and Pool Corp. more recently.

How these stocks compare

Most income investors would probably rank dividend yield near the top of the list of factors they consider when selecting stocks to buy. We can eliminate a few of Buffett’s Q2 purchases from contention because of low dividend yields: Allegion, D.R. Horton, and Heico. Lamar Advertising offers the juiciest yield, followed by Chevron.

However, yield isn’t everything. Income investors also want sustainable dividends. One of the most popular ways to determine the sustainability of a dividend is the payout ratio. Lamar Advertising’s payout ratio of 137.5% raises questions about how long the company will be able to fund the dividend at current levels. Constellation Brands’ payout ratio of 104.5% is also somewhat concerning. All of the other dividend stocks bought by Buffett in Q2, though, have payout ratios below 100%.

Many income investors like stocks with long track records of dividend increases. Although there aren’t any Dividend Kings on Buffett’s Q2 list, there is one Dividend Champion (stocks with 25 or more years of dividend hikes). Chevron has increased its dividend for 38 consecutive years.

Valuation is a factor for some income investors. They don’t want to buy a stock that’s so overpriced it could fall and offset any dividends received. Heico’s forward price-to-earnings ratio of 59.5 could cause some income investors to cross it off the list. So could Pool Corp. and Lamar’s forward earnings multiples of 29.9 and 29.5, respectively.

The best of the bunch for income investors

I think two stocks stand out as especially good picks for income investors right now among the 12 stocks bought by Buffett in Q2.

The runner-up is UnitedHealth Group. The health insurer’s dividend yield is attractive. Its payout ratio is a low 36.8%. UnitedHealth should be able to return to growth next year as it implements premium increases.

But Chevron is the best of the bunch, in my opinion. The oil and gas giant offers a juicy dividend yield. It has an impressive track record of dividend increases. The stock isn’t cheap, but neither is it absurdly expensive, with shares trading at 20 times forward earnings. Income investors should be able to count on steady and growing dividends from Chevron for a long time to come.

Keith Speights has positions in Berkshire Hathaway and Chevron. The Motley Fool has positions in and recommends Berkshire Hathaway, Chevron, D.R. Horton, Domino’s Pizza, and Lennar. The Motley Fool recommends Constellation Brands, Heico, and UnitedHealth Group. The Motley Fool has a disclosure policy.

Source link

What Is the Highest Domino’s Pizza Stock Has Ever Been?

It’s been below its previous high for longer than investors would have liked.

On Dec. 31, 2021, shares of Domino’s Pizza (DPZ 2.08%) closed at an all-time high of $564.33 per share. And investors were undoubtedly thrilled. After all, anyone who invested $10,000 just five years earlier had seen the value climb to over $35,000 during this time.

Unfortunately, Domino’s Pizza stock hasn’t performed as well for investors since that all-time high on the final day of 2021. Since then, shares have dropped by about 20% — not something one wishes to see after patiently holding for about 3.5 years.

Friends eat a pizza together.

Image source: Getty Images.

Domino’s has only grown at a modest pace in recent years, which is certainly contributing to its underwhelming stock performance. Revenue in 2024 was only 8% higher from revenue in 2021. And its earnings per share (EPS) of $16.69 in 2024 was only up 23% from EPS of $13.54 in 2021.

Companies that only post single-digit growth numbers often fail to outperform the S&P 500 over the long term. And that’s what’s happened with Domino’s Pizza stock, considering the S&P 500 is up more than 30% since Domino’s hit its all-time high.

Can Domino’s stock do better from here?

Domino’s Pizza needs better growth for its stock to perform better. And being the largest pizza chain in the world already, this could be challenging. Management only expects single-digit top-line growth for the foreseeable future. But with share repurchases, it could push its EPS growth to about 10% annually.

This still might not be enough growth on the bottom line to outperform the S&P 500 over the long term. That said, it could be enough growth to allow the stock to rise in coming years, albeit at a modest pace.

Therefore, while it may not be a market beater, investors can be encouraged that Domino’s Pizza could reach a new all-time high within the next few years.

Jon Quast has no position in any of the stocks mentioned. The Motley Fool has positions in and recommends Domino’s Pizza. The Motley Fool has a disclosure policy.

Source link

Is NuScale Power Stock a Buy Now?

NuScale Power (SMR 2.45%) is making material progress with its business, and Wall Street has rewarded it for its achievements. But it still hasn’t reached one critical milestone. And how you interpret that fact will make a big difference in whether or not you’ll think that NuScale Power is a buy right now.

What does NuScale Power do?

At this moment, NuScale Power is largely a consultant, providing analysis services that generate revenue. But what it really wants to do is build small modular nuclear reactors, also known as SMRs. The consulting work it is providing now is to Romanian power company RoPower, which is trying to reach a final decision on whether it will build a power plant using NuScale’s SMRs.

A piggy bank looking through binoculars.

Image source: Getty Images.

SMRs are a new technology in the nuclear power industry, which up until now has featured large, permanently installed reactors constructed on site. These are costly and time consuming to build. SMRs would change the nuclear power model in a big way. The reactor would be built in a factory while the facility is built concurrently, helping to reduce costs and increase speed. They would be small enough to transport to the locations where they were needed and safe enough to be placed relatively close to population centers. They could be a great alternative power source for companies from electric utilities to data center owners.

NuScale has achieved some important milestones. For example, management likes to highlight that the company “remains the only SMR technology company to have received approval from the U.S. Nuclear Regulatory Commission (NRC) for its SMR technology design.” On that front, NuScale has received approval for an upgraded version of its tech that can provide a higher electricity output than its original model. So not only has its SMR design been approved by the NRC, but it has been approved twice.

The next big step for NuScale

The biggest achievement for NuScale so far, however, was winning a contract to provide design and engineering services for six SMR modules to RoPower. That work is being done in preparation for the customer’s final decision on whether to go ahead with the project, under which those six modules would be linked together to create one large nuclear power plant. RoPower is expected to make the final call on this capital investment in the first half of 2026. The timeline for that decision has been pushed out a bit from its earlier target date: That isn’t unusual in this industry, but it highlights the risks for NuScale Power and its investors.

Right now, NuScale Power is providing consulting services to RoPower to help the utility make the final call on the investment. This is a big deal: NuScale Power is already investing in the production of the parts needed to build the six SMRs that RoPower is expected to buy. And, perhaps even more important, the RoPower deal would be the first commercial sale of NuScale’s SMRs. If the project gets the green light, NuScale will have a customer to use as an example when it’s trying to sell additional SMRs to new customers.

In other words, there is a lot on the line for NuScale, and over the next year or so, investors will learn a lot about its future. Given the roughly 300% increase in NuScale Power’s stock price over the past year, however, it looks like investors have priced in a lot of expected good news. And that creates a problem for investors.

Buy now or wait for the RoPower deal?

Because the company is not profitable, investors can’t use the price-to-earnings ratio to put a valuation on it. Meanwhile, because its sales are so modest, its price-to-sales ratio is a very high 70. Even so, if you’re a fairly aggressive investor and you expect a positive outcome with the RoPower deal, you should consider buying NuScale Power today. If that deal to actually construct and install those six SMRs does go through, the future will look materially brighter for NuScale Power, and likely for its stock, too.

That said, more conservative investors interested in the company would probably be better off waiting for the RoPower deal to actually get finalized. If the RoPower transaction falls apart, NuScale’s stock could slide significantly. While waiting to buy could mean missing out on some of the potential gains, it probably won’t mean missing out on all of them, given the long-term opportunities presented by SMR technology.

Source link

Palantir Slipped Today — Is the Artificial Intelligence (AI) Stock a Buy Right Now?

Palantir (PLTR -0.98%) stock saw another pullback in Monday’s trading. The company’s share price closed out the daily session down 1% but had been down as much as 5.9% shortly before 10 a.m. ET. The S&P 500 (^GSPC -0.43%) ended the day down 0.4%, and the Nasdaq Composite (^IXIC -0.22%) was down 0.2%.

While there doesn’t appear to have been any major business news behind Palantir’s valuation contraction today, the broader market saw moderate selling pressures that seem to have impacted the stock. The stock is now down 10% over the last week of trading and 16% from its all-time high.

AI on a chip on a circuit board.

Image source: Getty Images.

Is Palantir stock a buy right now?

Palantir is one of the strongest overall players in the artificial intelligence (AI) software space, and it’s been posting momentous sales and earnings growth. On the other hand, it’s not as if the company hasn’t already gotten a lot of valuation credit for its strong business growth and long-term expansion opportunities.

PLTR PE Ratio (Forward) Chart

PLTR PE Ratio (Forward) data by YCharts

Trading at approximately 90 times this year’s expected sales and 242 times expected non-GAAP (generally accepted accounting principles) adjusted earnings, Palantir has a valuation profile that stands out as being extraordinarily growth dependent even among the field of high-flying AI stocks. Despite the stock seeing a significant pullback from its all-time high, Palantir is still up 108% across 2025’s trading and 1,840% over the last three years.

Recent sell-offs connected to macroeconomic risk factors and concerns about the current state of practical business applications for AI technologies are a reminder of the high level of risk that comes with investing in a company that already has a lot of explosive growth priced into its valuation. Along those lines, Palantir is probably still too richly valued to be a sensible investment for investors without very high levels of risk tolerance.

While I think the stock looks quite risky right now, I also think that it has a good chance of significantly outperforming the broader market over the next five years. In addition to very strong momentum with private-sector customers, Palantir’s heavy exposure to the defense industry suggests that the stock comes with characteristics that help offset some of the risks associated with the biggest sources of potential geopolitical destabilization for the market.

Keith Noonan has no position in any of the stocks mentioned. The Motley Fool has positions in and recommends Palantir Technologies. The Motley Fool has a disclosure policy.

Source link

Why GoPro Stock Rocketed 36% Higher Today

The market might have been irrationally exuberant, given the action camera maker’s recent performance.

Investors sure liked what they saw when peering through the viewfinder of GoPro (GPRO 35.54%) stock on Monday. Absent of any proprietary, share price-moving news, the company seemed to benefit from what appeared to be the latest meme stock rally.

With this considerable tailwind, GoPro shares closed the day almost 36% higher in price, numerous orders of magnitude better than the S&P 500‘s (^GSPC -0.43%) 0.4% drop.

A modern watercooler stock

GoPro is one of the latest crop of meme stocks, and as ever, that clutch of titles can rocket higher or plunge lower, depending on internet chatter.

Happy person using headphones and a phone while lying on a couch.

Image source: Getty Images.

This has happened to GoPro before, and it seems as if it fueled Monday’s surge — after all, the company had no news of its own to report, nor did it disclose any developments in its operations (or with its stock) in any regulatory filing.

One key element that puts GoPro in a position where it can be very volatile on the market is its extremely low price (which was barely over $1.20 Monday morning before the rally kicked in). At such a level, it doesn’t take much to move a stock drastically either up or down, so even a little bit of online buzz can move GoPro sharply.

A concerning quarter

Although the company didn’t have any news to report today, it’s hit the headline in recent trading sessions. Earlier this month it published its second-quarter earnings report, revealing a worrying (18%) year-over-year decline in revenue, on the back of a 23% decline in action cameras, its main product category.

It also posted the latest in a string of bottom-line losses, although that latest deficit was narrower than that of the year-ago period.

Eric Volkman has no position in any of the stocks mentioned. The Motley Fool has no position in any of the stocks mentioned. The Motley Fool has a disclosure policy.

Source link

Why Dogecoin (DOGE) Sank Today

The meme coin fell hard.

Dogecoin (DOGE -8.63%) is falling on Monday, down 10.6% in the last 24 hours as of 5:47 p.m. ET. The drop comes as the S&P 500 lost 0.5%, and the Nasdaq Composite lost 0.3% today.

Dogecoin and the rest of the crypto market are down after last Friday’s huge spike following Fed Chair Jerome Powell’s address to the nation.

Rate cuts could be coming

Federal Reserve Chairman Jerome Powell spoke from the Fed’s annual Jackson Hole summit on Friday, shedding light on its plans for rate cuts in the near future. Powell painted a complicated picture of the current economy with signs of a slowdown in hiring happening even as other signs point to the possibility that inflation is heating up.

Ultimately, he believes that the economy has proven to be resilient, and though he didn’t confirm it explicitly, he seemed to indicate rate cuts were coming in September. Investors reacted strongly to the news, and markets on Friday were green. More speculative investments like Dogecoin saw an outsized spike — lower rates tend to lead to riskier assets performing comparatively well.

A downward arrow designed as a series of steps against a wall.

Image source: Getty Images.

Today, investors appear to be weighing how much the Fed will cut. Just as Dogecoin saw an outsized spike on Friday, it saw an outsized dip today.

Dogecoin is meant to be taken lightly

Dogecoin is a meme coin. It is not a serious investment. The coin’s “tokenomics” are highly inflationary. That means over time, unless more and more people invest consistently, its price will continue to move downward.

This was created as a joke and a way to have fun — that is exactly how it still should be treated. There are plenty of crypto projects with proven track records of value like Bitcoin and Ethereum. Choose these or projects like them if you are serious about investing in crypto.

Johnny Rice has no position in any of the stocks mentioned. The Motley Fool has no position in any of the stocks mentioned. The Motley Fool has a disclosure policy.

Source link

Senstar (SNT) Q2 2025 Earnings Call Transcript

Logo of jester cap with thought bubble.

Image source: The Motley Fool.

Date

Monday, August 25, 2025 at 5 p.m. ET

Call participants

Chief Executive Officer — Fabien Haubert

Chief Financial Officer — Alicia Kelly

Operator

Need a quote from a Motley Fool analyst? Email [email protected]

Takeaways

Total revenue— driven by a 27% aggregate increase across four core verticals in the fiscal second quarter ended June 30, 2025.

Gross margin— Gross margin of 66.1% in the fiscal second quarter ended June 30, 2025, up 292 basis points from 63.2% a year ago, reflecting favorable product mix and cost optimizations.

Operating expenses— $5.4 million in operating expenses in the fiscal second quarter ended June 30, 2025, an 18% increase primarily attributable to one-time redomiciliation costs and strategic hires.

Operating margin— Operating margin of 10.1% in the fiscal second quarter ended June 30, 2025, expanding more than 200 basis points with operating income of $1 million, up 46%.

EBITDA— EBITDA was $1.1 million in the fiscal second quarter ended June 30, 2025, up from $846,000 a year ago, with EBITDA margin (non-GAAP) increasing by 161 basis points to 11.8%.

Net income— $1.2 million, or 5¢ per share, in the fiscal second quarter ended June 30, 2025, more than doubling from $493,000, or 2¢ per share, in the prior-year quarter (GAAP).

Cash and short-term deposits— $21.9 million, with no debt reported as of June 30, 2025.

EMEA revenue growth— 52% growth in the fiscal second quarter ended June 30, 2025, raising EMEA’s share of total revenue to 35%, up from 27% a year ago.

North America revenue growth— North America revenue increased 29% year over year in the fiscal second quarter ended June 30, 2025.

APAC region— APAC revenue decreased 47% in the fiscal second quarter ended June 30, 2025, due to a nonrecurring large contract recognized in the prior-year quarter.

LATAM performance— LATAM returned to growth in the fiscal second quarter ended June 30, 2025, with revenue up 26%.

Nonrecurring costs— One-time administration fees related to the company’s final legal redomiciliation to Canada.

Strategic investment— Expansion of the business development team and renewed focus on penetration in data center, utility, airport, and energy verticals.

Product innovation— Ongoing progress with multisensor technologies, targeting high-value solutions and reduced alarm rates.

Geographic revenue mix— North America at 53%, EMEA at 35%, APAC at 11%, and LATAM at 1% of total revenue in the fiscal second quarter ended June 30, 2025, compared to the prior-year quarter.

Summary

Management reported significant margin expansion in the fiscal second quarter ended June 30, 2025, reflecting a favorable sales mix and disciplined cost optimization. EMEA delivered notable growth, now comprising 35% of total revenue in 2025, attributed to both regional investments and vertical strength in energy and infrastructure.Senstar(SNT 2.98%) highlighted the impact of nonrecurring administrative expenses linked to the completed redomiciliation from Israel to Canada during the fiscal second quarter ended June 30, 2025. Strategic priorities include accelerated business development and innovation in multi-sensor technology as Senstar advances its competitive position. No financial leverage was present at quarter-end, providing flexibility for further investment or operational initiatives.

Fabien Haubert said, “Revenue for our four core verticals increased by 27% in aggregate year over year, leading to total consolidated revenue growth of 16.2% and robust expansion in both gross and EBITDA margins.”

Alicia Kelly stated, “the one-time administration fees were relating to consulting fees for concluding the final processes related to our Israeli entity. Now that we have completed the flip and we have redomiciled to Canada, there were a couple of outstanding activities that just needed to be closed up.”

Management identified broad-based adoption for security solutions in airports, data centers, and utility infrastructure, with broadening use cases beyond traditional perimeter defense.

Senstar is actively pursuing growth in noncritical infrastructure segments, including hospitals, educational institutions, and logistics facilities, leveraging technological differentiation.

Industry glossary

Perimeter Intrusion Detection Systems (PIDS): Integrated sensor systems designed to detect physical breaches along facility perimeters, leveraging technologies such as fence-mounted, buried, or free-standing sensors.

Multisensor: Security solutions combining several detection modalities (e.g., thermal, vibration, video analytics) for enhanced accuracy and reduced false alarm rates in perimeter monitoring.

Redomiciliation: The corporate process of changing a company’s home country or legal domicile to another jurisdiction.

Full Conference Call Transcript

Fabien will summarize key financial and business highlights followed by Alicia, who will review Senstar’s financial results for 2025. We will then open the call for a question and answer session. I would like to remind participants that all financial figures discussed today are in US dollars and all comparisons are on a year-over-year basis unless otherwise indicated. Before we start, I would like to point out that this conference call may contain projections or other forward-looking statements regarding future events or the company’s future performance. Statements are only predictions, and Senstar cannot guarantee that they will, in fact, occur. Senstar does not assume any obligation to update that information.

Actual events or results may differ materially from those projected, including as a result of changing market trends, reduced demand, the competitive nature of the security systems industry, as well as other risks identified in the documents filed by the company with the Securities and Exchange Commission. In addition, during the course of the conference call, we will describe certain non-GAAP financial measures, which should be considered in addition to and not in lieu of comparable GAAP financial measures. Please note that in our press release, we have reconciled our non-GAAP financial measures to the most directly comparable GAAP measures in accordance with Reg G requirements.

You can also refer to the company’s website at www.senstar.com for the most directly comparable financial measures and related reconciliations. And with that, I would now hand the call over to Fabien. Fabien, please go ahead.

Fabien Haubert: Thank you, Corbin. Thank you for joining us today to review Senstar Technologies’ second quarter 2025 financial results. We delivered strong second quarter results marked by the successful execution of our growth strategy and targeted investments to drive sales across our key verticals and geographies. Revenue for our four core verticals increased by 27% in aggregate year over year, which led to total consolidated revenue growth of 16.2% and robust expansion in both gross and EBITDA margins. Now moving on to a review of quarterly highlights. Revenue in the second quarter was driven by a well-balanced mix of products with notable vertical market strength from energy and corrections.

This result reflects the sustained customer demand and, when combined with our cost optimizations and focus on selling high-value-added solutions, drove a material gross margin expansion to 66.1% in the second quarter, comfortably above our targets. We are continuing to invest in technological innovation to protect our competitive positioning and fuel growth while diligently managing costs to deliver margin expansions and sustainable profitability. In the second quarter, operating expenses remained relatively stable as a percentage of revenue at 56% compared to 55% in the prior year quarter, despite an 18% increase in absolute terms. This operational leverage, combined with strong double-digit growth in revenue and gross profit, drove EBITDA to $1.1 million.

EBITDA margin expanded by 161 basis points to 11.8%. Net income increased significantly compared to the same period last year. In terms of the core geographic markets we served, Senstar’s global diversification continues to strengthen, with EMEA, North America, and LATAM delivering broad-based double-digit gains across our key verticals. In EMEA, the region is becoming a larger contributor to revenue and grew by 52% in the core second quarter while also gaining over 800 basis points in share of total sales. Our sustained investment in Europe over the previous years is coming to fruition, with the EMEA region now representing 35% of total revenue, up from 27% in the year-ago period.

The main verticals driving this record in the region include energy, particularly oil and gas, along with solar farms and electrical generation. In addition, there has been solid customer adoption in higher set value airport and data center infrastructure. In North America, which remains our largest market as a percentage of sales, revenue increased by 29% in the second quarter, mainly due to continued momentum in the correction and utilities verticals. North America delivered solid growth in the quarter despite moderate sales performance in Canada, declining slightly in the second quarter after a strong first quarter.

In the second quarter of this year, the Asia Pacific region faced a challenging year-over-year comparison against exceptionally strong growth of 135% in the prior year quarter, resulting in a 47% revenue decline versus the same quarter last year. The year-ago quarter included a large customer contract which did not repeat this quarter. Historically, APAC has been among the fastest-growing regions for Senstar, and we are continuing to experience strength from data centers, utility, and airport perimeter security solutions. In contrast, the LATAM region returned to growth in the second quarter with revenue increased by 26% compared to the year-ago period.

We attribute this turnaround to the successful execution of our strategy aimed at delivering industry-leading solutions to international markets, where security modernization is becoming an increasing priority. Looking at revenue contribution per vertical, our four key verticals grew 27% aggregate in the second quarter, driven primarily by strong performance in correction and energy. We are continuing to identify material growth across support growth opportunities, across renewable energy, data centers, and utilities, and Senstar is reinforcing its commitment to further penetrate those verticals and capture market share. In terms of product updates, technological innovation is the cornerstone of our strategy to strengthen our competitive positioning in the market.

We are continuing to make meaningful progress with multisensor, an important validation by our customers. Senstar is focused on delivering advanced and disruptive security solutions tailored to our targeted vertical markets. We aim to enhance security and operational efficiency by combining cutting-edge sensors with intelligence information management software. This strategy enables Senstar to grow its market share within core sectors while expanding its scope by offering differentiated, high-value solutions that sustain our growth margins of 60% and above. In addition, Senstar is actively working to broaden its addressable market by targeting the protection of critical points within noncritical infrastructure, such as hospitals, educational institutions, and logistic facilities.

Leveraging our unrivaled multisensor, we deliver unique performance by eliminating nuisance alarm rates, optimizing total cost of ownership, and significantly reducing installation and maintenance costs, unlocking opportunities in much larger market segments. Turning to other strategic initiatives, as discussed on the prior earnings conference call, we are pleased with the execution of our business development team following the addition of several key hires earlier this year. The team is now fully ramped and gaining traction with the core focus on driving growth through new customer acquisition and broader penetration within our core verticals.

Based on encouraging initial results, we plan to expand the team further to support the development of several large accounts and accelerate market share gain across high-potential sectors. In summary, our second quarter results demonstrate the resiliency of our business model, with continued momentum in both revenue growth and margin expansion. We remain focused on differentiating ourselves from the competition by investing in innovative security solutions for our international customer base. I want to express my gratitude to our employees for their strong execution of our strategy to grow our market share across key global verticals, to our valued customers for their continued partnerships, and to our shareholders for their ongoing support. Thank you for your attention.

I will now turn the call over to Alicia for a review of the financial results in more detail.

Alicia Kelly: Thank you, Fabien. Our revenue for 2025 was $9.7 million, representing a 16.2% increase compared to $8.3 million in 2024. The sales expansion was driven by holistic growth across our key geographic and vertical markets, with corrections, energy, and utilities serving as strong contributors. EMEA led the geographic regions with 52% year-over-year growth. New customer wins and increased cross-selling with existing customers drove the successful performance in the quarter, most notably in the energy, data center, and airport perimeter security verticals. The US followed with a 35% increase in revenue, fueled mainly by the continued demand in the corrections, energy, and utility industries, where customers are increasingly seeking innovative security solutions.

The LATAM region experienced an important inflection point in the quarter, with revenue increasing by 26%. As we have stated in the prior quarters, demand for security modernization in LATAM remains, and we continue to believe the region represents an important growth opportunity. The Asia Pacific region, on the other hand, experienced pressure in the quarter, with sales declining by 47%, primarily resulting from the phase-out of a customer contract that did not contribute revenue in the current quarter, in addition to the challenging year-ago growth comparison that Fabien discussed previously.

Similarly, revenue from Canada declined in the quarter due to normal quarterly fluctuations in the timing of contract awards, but we remain well-positioned to capture new projects through the remainder of this year. As mentioned in Q1, Canada was the strongest growing region with sales primarily generated by the corrections and energy sector segments. The geographical breakdown as a percentage of revenue for 2025 compared to the prior year quarter is as follows: North America, 53% versus 47%; EMEA, 35% versus 27%; APAC, 11% versus 23%; Latin America, even at 1%; and all other regions were immaterial for both periods. Second quarter gross margin was 66.1% compared to 63.2% in the year-ago quarter.

This 292 basis point margin improvement was primarily the result of strong expense controls, more favorable product mix, and component and design cost optimizations. Our operating expenses were $5.4 million, up 18% compared to $4.6 million in the prior year’s second quarter. The increase was primarily driven by one-time nonrecurring administrative costs associated with finalizing the corporate redomiciliation from Israel to Canada, as well as the addition of key personnel to keep our company headcount and targeted selling spend in core growth verticals and markets, with a positive offset from research and development investment optimization.

Strong revenue and a sizable increase in gross margin drove our operating income for the second quarter to $1 million, a 46% improvement compared to $700,000 in the prior year ago period. Operating margin expanded by over 200 basis points, reaching 10.1% in the quarter. The company’s EBITDA for the second quarter was $1.1 million compared to $846,000 in the second quarter of last year, with margins expanding by 161 basis points to 11.8% from 10.2% in the year-ago quarter. These gains underscore the operating leverage in Senstar’s operating model as we scale. Financial expense was $330,000 in the second quarter of this year compared to financial income of $103,000 in the second quarter of last year.

This is mainly a noncash accounting effect we regularly report due to adjustments in the valuation of our monetary assets and liabilities denominated in currencies other than the functional currency of our operating entities in the group, in accordance with GAAP. Net income attributable to Senstar Technologies shareholders in the second quarter was $1.2 million or 5¢ per share compared to a net income of $493,000 or 2¢ per share in the second quarter of last year. Added to Senstar’s operational contribution are the public platform expenses and amortization of intangible assets from historical acquisitions. The corporate expenses for the second quarter were approximately $865,000 compared to roughly $400,000 in the year-ago period.

Turning next to our balance sheet, cash and cash equivalents and short-term bank deposits as of June 30, 2025, were $21.9 million or 94¢ per share. This compares to $20.6 million or 88¢ per share as of December 31, 2024. The company had zero debt as of June 30, 2025. This concludes my remarks. Operator, we would like to open the call to questions now.

Operator: Thank you. We will now be conducting a question and answer session. For participants using speaker equipment, it may be necessary to pick up your handset before pressing the star keys. One moment, while we poll for questions. Our first question is from Noam Nakash with IMA Value. Hi, guys.

Noam Nakash: Thanks for a great quarter. If you can elaborate about the one-time expense. What is the expense exactly, and if you can elaborate about the border control segment and biddings.

Fabien Haubert: Okay. If you agree, I am fine with starting with the border control before letting Alicia comment on the one-time expense. So border control is not one of our main target verticals, but clearly, as per the current situation where tension between countries is very high, yes, we are active in this sector. The main reason why we are not active in this vertical is that it is highly scalable because it depends basically on specific, I would say, on specific circumstances due to political, war, whatever scenarios. But, as far as we can contribute to make them safer, we are happy to technologically contribute to those, supporting our partners. I hope I answered your question.

So we cover this market without it being a fundamental of our verticals. Alicia?

Alicia Kelly: For the first part of your question, so the one-time administration fees were relating to consulting fees for concluding the final processes related to our Israeli entity. Now that we have completed the flip and we have redomiciled to Canada, there were a couple of outstanding activities that just needed to be closed up in order to finish with that legal entity.

Noam Nakash: Thank you very much.

Alicia Kelly: Thank you.

Operator: Thank you. There are no further questions at this time. Mr. Haubert, would you like to make your closing remarks?

Fabien Haubert: On behalf of Senstar Management, I would like to thank our investors for their interest and long-term support of our business. Have a great day.

Operator: This concludes today’s conference. You may disconnect your lines at this time. Thank you for your participation.

Source link