buy

Is the Schwab US Dividend Equity ETF a Buy Now?

This exchange-traded fund’s persistent underperformance may be on the verge of reversing course.

Are all dividend funds the same? They often are, even if each one is structurally and strategically unique. There’s only so much difference possible when a company and its stock’s primary purpose is just generating cash flow.

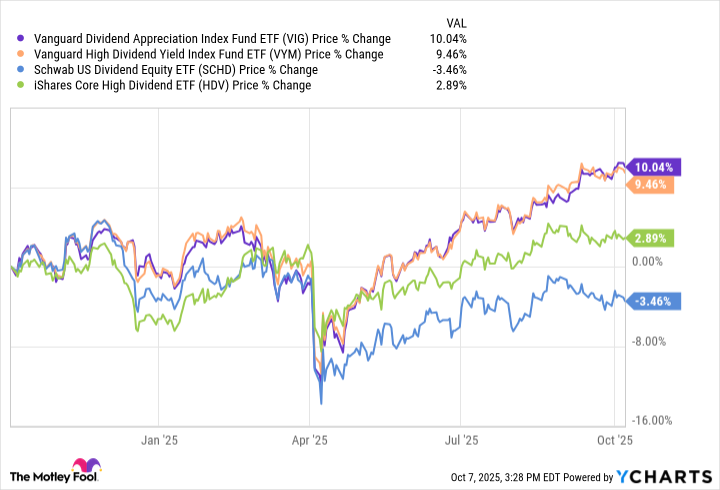
And yet, owners of the Schwab U.S. Dividend Equity ETF (SCHD -1.70%) know all too well that dividend-oriented exchange-traded funds can at times be considerably different than one another. Their fund has measurably underperformed other dividend ETFs like the Vanguard Dividend Appreciation ETF, the iShares Core Dividend Growth ETF, and Vanguard High Dividend Yield ETF over the course of the past three years. Indeed, the disparity’s been wide enough to leave them wondering if they made a mistake that should be corrected as soon as possible.

Well, they didn’t make the wrong choice, so there’s no correction to be made. The very reason this dividend ETF has underperformed of late, in fact, is the very same reason income-seeking investors might want to buy the Schwab U.S. Dividend Equity ETF now.

The same, but different — and more different than the same

What’s Schwab’s U.S. Dividend Equity ETF? It’s meant to mirror the performance of the Dow Jones U.S. Dividend Index, which, just as the name suggests, is dividend-focused. So is the Morningstar US Dividend Growth Index that serves as the basis for iShares’ Core Dividend Growth ETF, though, along with the Vanguard Dividend Appreciation ETF’s underlying S&P U.S. Dividend Growers Index, for that matter.

They’re not all the same, though. And it matters.

Take a comparison of the S&P U.S. Dividend Growers Index behind Vanguard’s Dividend Appreciation fund to the iShares Core Dividend Growth ETF’s Morningstar US Dividend Growth Index as an example. The former consists of U.S.-listed companies that have raised their dividend payments for at least the past 10 years, but it excludes the very highest-yielding tickers (on concerns that the high yields are unsustainable). The latter only requires five years of uninterrupted dividend growth, although it also generally excludes stocks with suspiciously high yields.

End result? The Vanguard fund’s top three holdings right now are Broadcom, Microsoft, and JPMorgan Chase, while the iShares ETF’s biggest three positions at this time are Apple, Microsoft, and Johnson & Johnson. They’re more different than alike, even if there is some overlap.

Middle-aged man reviewing paperwork while seated in front of a laptop.

Image source: Getty Images.

The Vanguard High Dividend Yield ETF’s underlying FTSE High Dividend Yield Index, by the way, currently holds Broadcom, JPMorgan, and Exxon-Mobil as its top three positions — three names that offer the high yield that the index prioritizes. Even so, the fund’s trailing yield is a modest 2.45% at this time, versus the iShares ETF’s yield of 2.2% and the trailing dividend yield of 1.6% currently offered by the Vanguard Dividend Appreciation fund.

Where does Schwab’s U.S. Dividend Equity ETF stand? The Dow Jones U.S. Dividend Index’s biggest three positions right now are AbbVie, Lockheed Martin, and Cisco Systems, followed closely by Merck and ConocoPhillips. In fact, you won’t start seeing any serious overlap between this fund and the other three dividend ETFs in focus here until those positions are so small that they don’t really matter.

That’s why this ETF has underperformed the other three funds in question since early 2023; it’s not holding many of the market’s most popular growth names right now. Indeed, it currently holds a bunch of the market’s least popular value stocks.

SCHD Total Return Level Chart

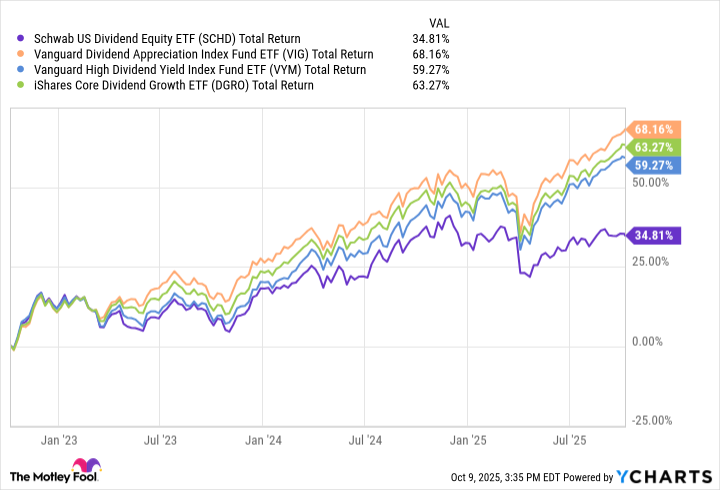
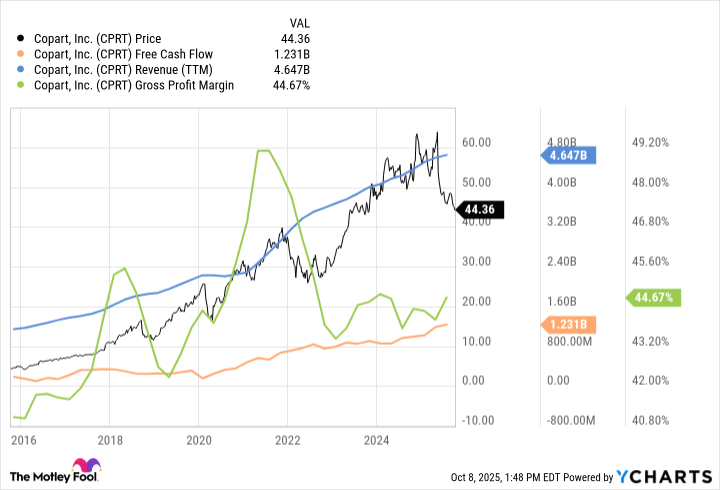
SCHD Total Return Level data by YCharts

But that’s exactly why income-minded investors might want to dive into the Schwab ETF at this time, particularly in light of its sizable trailing dividend yield of right around 3.7%.

What went wrong for dividend-paying value names?

In retrospect, the fund’s recent underperformance actually makes a lot of sense. The few technology stocks that pay any dividend at all have performed exceedingly well since the launch of OpenAI’s ChatGPT in November 2022, setting off an artificial intelligence arms race that sent a bunch of these stocks sharply higher. The dynamic was also bullish for financial stocks like JPMorgan, which helps companies raise funds or make the acquisitions they need to take full advantage of the AI revolution.

At the other end of the spectrum, most of the Schwab U.S. Dividend Equity ETF’s holdings have been on the wrong side of one force or another. Regulatory headwinds and the impending expiration of key patents have proven problematic for pharmaceutical outfits AbbVie and Merck, for instance.

Inflation and the subsequent rise in interest rates are another one of these forces, and arguably the biggest. Although both have historically been more of a challenge for growth stocks than value names, in this instance, the opposite has been (mostly) true.

Just bear in mind how incredibly unusual the past three years have been. The bulk of growth stocks’ leadership has been fueled by the aforementioned advent of artificial intelligence, creating a secular growth opportunity that wouldn’t be stymied by any economic backdrop.

Also know that the so-called “Magnificent Seven” stocks have done the vast majority of the market’s recent heavy lifting, so to speak, fueled by AI. Data from Yardeni Research suggests that without the help of these seven tech-centric tickers, the S&P 500‘s would be about one-third less than what it’s actually been since early 2023.

It would also be naïve to pretend that value stocks like Merck, Cisco, and ConocoPhillips just haven’t offered the excitement that most investors have craved in the post-pandemic, AI-centered environment.

Here comes the pendulum

As is always the case, though, the cyclical pendulum will eventually swing back the other way. And that’s likely to happen sooner or later. As number-crunching done by Morningstar analyst David Sekera recently prompted him to note, “By style, value remains undervalued, trading at a 3% discount, whereas core stocks are at a 4% premium and growth stocks are at a 12% premium.” He adds, “Since 2010, the growth category has traded at a higher premium only 5% of the time.”

This dynamic, of course, works against dividend ETFs’ growth names, and works for dividend ETFs like the Schwab U.S. Dividend Equity ETF, which almost exclusively holds value stocks. The market just needs a catalyst to start such a shift.

That may be in the offing, though. JPMorgan CEO Jamie Dimon recently lamented in an interview with the BBC, “I am far more worried about that [a market correction] than others… I would give it a higher probability than I think is probably priced in the market and by others.” And this worry follows Federal Reserve Chairman Jerome Powell’s recent comment that U.S. stocks are “fairly highly valued.” That’s a screaming red flag from someone who makes a point of maintaining composure and not inciting panic.

Sure, such a setback could undermine the Schwab U.S. Dividend Equity ETF as much as it does any other stock or fund. That’s not the chief concern of any correction, though. It’s what happens afterward. That bearish jolt may well inspire investors to rethink everything about the risks they’ve been taking, souring them on tech names and turning them onto value names that also dish out above-average income.

You’ll just want to be positioned before it all starts to happen.

Source link

The Smartest Growth Stock to Buy With $100 Right Now

This beaten-down drugmaker is well positioned to turn things around.

One of the great things about equity markets is that excellent stocks can be had at almost any price, making them accessible to most people. Even with $100, it’s possible to find outstanding, growth-oriented companies to invest in. Of course, what qualifies as “the smartest” stock to buy with any amount of money will differ from one investor to the next, depending on factors such as risk tolerance, goals, and investment horizon.

One growth stock trading for well below $100 that can meet many investors’ demands is Novo Nordisk (NVO -2.96%). Here is why the Denmark-based company is an excellent stock to buy right now.

Patient self-administering a shot.

Image source: Getty Images.

A wonderful contrarian opportunity

Quality growth stocks tend to be highly sought after. There is often a higher demand for shares of these companies than are available. That’s why their prices rise. Sometimes, though, these otherwise excellent companies encounter challenges that lead to a sell-off, providing investors with a wonderful opportunity to pick up their shares at a discount.

In my view, that’s what we have with Novo Nordisk. True, the company has faced some challenges, and it has paid for them as shares have remained southbound for over a year. Its financial results haven’t been as strong as expected. It hit a series of surprising clinical setbacks while losing market share to its rival, Eli Lilly.

However, Novo Nordisk’s prospects remain very strong. Novo Nordisk’s claim to fame is that it has been a major player in the diabetes drug market for decades. That remains the case. As of May, it had a 32.6% share of the diabetes market and a 51.9% share of the GLP-1 space. While its hold in these fields declined compared to last year, it remains a dominant force in both.

Novo Nordisk also continues to post competitive financial results for a pharmaceutical giant. The company’s sales for the first half of the year increased by a strong 16% year over year to 154.9 billion Danish kroner ($24.2 billion).

Further, the diabetes and obesity drug markets are rising fast due to several factors. Both conditions have skyrocketed in recent decades, and drugmakers are now developing highly innovative therapies to address them. Novo Nordisk is still at the forefront of this race. Even if the company has a smaller slice of the pie, that’s not a significant problem if the pie is substantially larger.

Can Novo Nordisk continue to launch innovative medicines and stay ahead of most of its peers, excluding Eli Lilly? The company’s pipeline suggests that it can, and could even catch up with its eternal rival. Consider Novo Nordisk’s potential triple agonist (a medicine that mimics the action of three gut hormones), UBT251.

In a 12-week phase 1 study, UBT251 resulted in an average weight loss of 15.1% at the highest dose. The usual caveats regarding early-stage studies apply. Still, UBT251 looks promising, especially since there is no single triple agonist approved for weight loss yet. And that’s just the tip of the iceberg. Novo Nordisk has several other exciting candidates through all phases of clinical development. And those that have already passed phase 3 studies, such as CagriSema, should generate massive sales for the drugmaker.

According to some projections, CagriSema could rack up $15.2 billion in revenue by 2030. Ozempic and Wegovy, Novo Nordisk’s current bestsellers, should also remain among the top-selling medicines in the world through the end of the decade. So, Novo Nordisk’s medium-term outlook seems promising.

There are more reasons to buy

Novo Nordisk appeals to growth-oriented investors, but it is also a great pick for dividend seekers and bargain hunters. For those seeking income stocks, the Denmark-based drugmaker is a great choice, given its strong track record. The company’s forward yield is not exceptional at 2.9% — although that’s much better than the S&P 500‘s average of 1.3% — but Novo Nordisk has consistently increased its dividends over the past decade.

NVO Dividend (Annual) Chart

NVO Dividend (Annual) data by YCharts

Finally, Novo Nordisk’s shares are trading at 14 times forward earnings, whereas the average for the healthcare industry is 17.3. Even with the challenges it has faced recently, Novo Nordisk’s strong pipeline and lineup, solid revenue growth, and excellent prospects in diabetes and weight management make the stock highly attractive. The company’s shares are changing hands for about $59, so $100 can afford you one of them.

Source link

This Disruptive Emerging Technology Stock Is Up Nearly 4,000% Since 2024. Is It Overheated or Is It a Screaming Buy?

Shares of AST SpaceMobile have climbed into the stratosphere.

Artificial intelligence (AI) stocks may have gotten most of the attention from investors over the last few years, but some of the period’s top-performing stocks don’t hail from the AI space — at least, not directly.

Instead, they represent emerging technologies like quantum computing, electric vertical takeoff and landing (eVTOL) aircraft, small modular nuclear reactors, and rockets and satellites. The artificial intelligence boom has provided a halo effect to other emerging technologies, as growth investors have become particularly keen to find those that might power the next breakout trend. Investing early in the company that may launch the next ChatGPT would produce huge returns, the thinking seems to go.

Thanks to the speculative optimism about their potential, many of these tech stocks have delivered returns of more than 1,000%, outperforming even Nvidia. However, few hot growth stocks have beaten AST SpaceMobile (ASTS -5.49%), which is building a satellite-based broadband network.

While it has yet to generate meaningful revenue, excitement around the business and its potential have surged recently as it has forged new agreements with customers. 

ASTS Chart

ASTS data by YCharts.

Over just the last 18 months, a $1,000 investment in AST SpaceMobile would have grown into a stake worth more than $35,000. But with that climb behind it, is it too late to buy the stock? 

What is AST SpaceMobile?

AST SpaceMobile is sometimes lumped together with other space and rocket companies like Rocket Lab, Planet Labs, and SpaceX and its Starlink subsidiary, but the company says its technology can be used with existing unmodified smartphones and operates within the low- and mid-band spectrum used by mobile network operators. That contrasts with existing space-based telecom services that are intended for low-data-rate applications, such as emergency service.

The company is building the first global cellular broadband network to connect with everyday smartphones. It intends for the technology to be used for commercial and government purposes, and is designed to reach places that are not covered by terrestrial cell towers.

It is deploying a constellation of low-Earth-orbit satellites and partnering with other telecoms to provide service to users. Founded in 2017, AST SpaceMobile launched its first test satellite in 2019 and now has a total of six satellites in orbit. It aims to have 45 to 60 satellites in orbit by 2026, serving the U.S., Europe, Japan, and other markets.

AST SpaceMobile has signed partnership deals with several global telecom companies, including AT&T, Vodafone, and Rakuten, and the stock just jumped on news that it had its expanded partnership with Verizon, adding to an earlier $100 million commitment from the telecom giant. According to the new agreement, Verizon will integrate AST SpaceMobile’s satellite network with Verizon’s 850 MHz spectrum across the country, allowing Verizon’s service to reach remote areas it doesn’t currently cover.

An AST satellite in space.

Image source: AST SpaceMobile.

Is AST SpaceMobile a buy?

The company expects to start booking meaningful revenues in the second half of the year. Management forecasts $50 million to $75 million in sales in the second half of 2025 as it deploys intermittent service in the U.S. That will soon be followed by service coming online in other markets like the U.K., Japan, and Canada.

Management hasn’t given a forecast for 2026, but investors expect its financial momentum to continue to build as new satellites go into service. The Wall Street consensus now predicts $254.9 million in revenue in 2026.

The company’s momentum, partnerships, and satellite deployments all sound promising, but much of its expected future success is already baked into the stock price.

AST SpaceMobile’s market cap has already soared to $31 billion, a huge number for a company that has yet to generate significant revenues. Notably, it also competes in an industry — internet connectivity — with notoriously low valuations. Verizon has a market cap of $172 billion, even though it generated nearly $20 billion in profits over its last four quarters. Internet service providers carry similarly underwhelming valuations. For example, broadband and cable service provider Charter Communications has a market cap of $36 billion, and it brought in $5 billion in net income over the last year.

The size of AST SpaceMobile’s total addressable market isn’t fully clear, though management says the global wireless services market produces over $1.1 trillion in annual revenue.

AST SpaceMobile is competing globally, which differentiates it from domestic services like Verizon. However, as it’s currently structured, the satellite company essentially aims to be a subcontractor for larger telecoms, and the telecom industry is decidedly unexciting, according to investors. As long as it’s beholden to that low-valuation ecosystem, it’s difficult to picture how the company could deliver the kind of blockbuster returns that investors seem to expect, especially considering that telecom is a mature industry.

At $31 billion, AST SpaceMobile’s market cap seems to have gotten well ahead of the reality of the business, especially as commercialization could present unforeseen challenges. In the near term, the stock could move higher if it signs more partnerships or announces other promising news, but given the sky-high valuation, the stock now looks overheated.

With AST SpaceMobile, investors are playing with fire at this point. Eventually, they’ll get burned.

Source link

Should You Buy Nvidia Before Nov. 19?

The best time to buy Nvidia stock this summer was well before its earnings report.

Nvidia (NVDA -4.84%) last reported earnings on Aug. 27. That was another blowout report from the artificial intelligence (AI) chip leader. Revenue soared 56% year over year in its fiscal 2026 second quarter, and sales of its AI platform Blackwell to data center clients grew by 17% from the prior quarter.

Yet Nvidia stock has only moved about 2% higher since that report as I write this on Oct. 7. That’s not because investors weren’t impressed with the company’s results. It’s because it has made a habit of beating expectations. Investors anticipated that it would do so again, and sent Nvidia stock soaring by nearly 20% in the weeks leading up to that report.

Nvidia is scheduled to report its fiscal third-quarter results on Nov. 19, and it’s possible that a similar scenario will play out this time around. That would make now the time to buy the stock — if you’re looking at the short term — ahead of its next run higher as investors jump in closer to the report date.

Nvidia headquarters with company sign out front at dusk.

Image source: Nvidia.

Don’t get complacent on Nvidia

Expectations will once again be high. For its fiscal 2026 third quarter, management has guided investors to expect about 15% sequential growth, or 54% year-over-year sales growth. That forecast is even more remarkable considering that it doesn’t include any potential H20 chip shipments to China.

Investors shouldn’t yawn at those numbers. After this many quarters of similarly incredible growth rates from the GPU leader, it’s possible that the market is starting to take them for granted. But investors shouldn’t forget just how much cash flow that growth will result in. That cash should eventually make its way back to shareholders through buybacks, dividends, or share price growth.

The lesson for investors is not to sleep on Nvidia. Expectations may be high, but this is not a story stock. Its revenues and cash flow are real. The next healthy slice of short-term gains for the stock might be arriving in the next few weeks, leading up to Nvidia’s Q3 earnings report. But this is a stock that it makes sense to own for the long term. That makes buying Nvidia stock now a smart move either way.

Howard Smith has positions in Nvidia and has the following options: short October 2025 $160 calls on Nvidia. The Motley Fool has positions in and recommends Nvidia. The Motley Fool has a disclosure policy.

Source link

Should You Buy and Hold Ford Stock to Beat the Market? History Says That’s Not a Brilliant Move.

The stock’s ultra-cheap valuation might entice investors looking to score big returns.

Ford (F -0.65%) impressed investors when it reported that U.S. unit sales jumped 8.2% year over year in the third quarter (ended Sept. 30). Key models are doing very well, like the F-Series pickup trucks, Mustang Mach-E, Expedition, and Bronco. The momentum is partly why shares have done well this year, rising 15% (as of Oct.10).

But can this auto stock beat the market for buy-and-hold investors? History provides a clear answer.

Ford front grill with Ford logo.

Image source: Getty Images.

Investors shouldn’t expect outsized long-term returns from Ford

In the past 10- and 20-year periods, Ford shares have generated total returns of 33% and 150%, respectively. These gains failed to exceed that of the S&P 500 index. And it’s not even close.

The disappointing performance likely won’t reverse course as we look to the next 10 or 20 years. Low growth, weak margins, huge capital expenditures, and cyclicality describe Ford’s business. It’s not controversial to say that this isn’t a high-quality company.

Ford shares might always trade at a cheap valuation

Ford’s valuation is dirt cheap. The market is offering the stock at a forward price-to-earnings ratio of 9, which makes the dividend yield hefty at 5.26%. This might look like a compelling opportunity.

However, there’s no reason to assume that the market will expand Ford’s valuation in the years ahead. Fast growth, wide margins, capital-light business models, and durable demand trends are traits that investors reward. Ford just doesn’t fit the bill.

Neil Patel has no position in any of the stocks mentioned. The Motley Fool has no position in any of the stocks mentioned. The Motley Fool has a disclosure policy.

Source link

2 Vanguard ETFs to Buy With $100 and Hold Forever

These two Vanguard ETFs pair well together.

Vanguard has built a business with the long-term investor in mind. Investors in its funds aren’t just clients, but part owners of the company. That’s why it has some of the lowest fees in the industry, as it passes profits on to its investors through lower fees on its funds.

You can buy and hold most Vanguard funds forever. A great pairing is the Vanguard Total Market Index (VTI -2.69%) and the Vanguard Total Bond Market ETF (BND 0.40%), as together they cover both major asset classes: stocks and bonds. With these two ETFs, you can build a simple 60/40 portfolio — $60 into VTI and $40 into BND for every $100 invested. Here’s why this is an ideal combination for long-term investors.

A person looking at a screen with the word ETF on it, along with several investing diagrams.

Image source: Getty Images.

The 60/40 portfolio

Investing in stocks is a great way to grow your wealth over the long term. However, stocks can be volatile. That’s why most financial advisors recommend that investors further diversify their portfolio by adding some bonds into the mix.

We can see how increasing a portfolio’s allocation to bonds can steadily lower the risk of having a terrible year:

Portfolio Allocation

Best Annual Return

Worst Annual Return

Average Annual Return

100% stocks/0% bonds

54.2%

-43.1%

10.5%

80% stocks/20% bonds

45.4%

-34.9%

9.7%

60% stocks/40% bonds

36.7%

-26.6%

8.8%

50% stocks/50% bonds

32.3%

-22.5%

8.2%

40% stocks/60% bonds

27.9%

-18.4%

7.7%

20% stocks/80% bonds

29.8%

-14.4%

6.4%

0% stocks/80% bonds

32.6%

-13.1%

5%

Data source: Vanguard. NOTE: Return calculations from 1926 through 2024.

The sweet spot has historically been the 60/40 mix. It offers an attractive return (8.8% annually) while significantly reducing volatility and risk.

Broad exposure to the U.S. stock market

The Vanguard Total Stock Market ETF is one of the simplest ways to invest in the stock market. It tracks the CRSP US Total Market Index, which measures the performance of all stocks on the major U.S. exchanges. The fund currently holds over 3,500 stocks, providing investors with broad exposure to the entire U.S. market.

It doesn’t buy the same amount of every single stock. It holds more of the largest companies by market cap. Its top five holdings currently are:

  1. Nvidia (6.5% allocation)
  2. Microsoft (6.1%)
  3. Apple (5.6%)
  4. Amazon (3.5%)
  5. Meta Platforms (2.6%)

That allocation provides greater exposure to the largest and most dominant companies in the country.

This ETF has produced solid returns throughout its history:

Fund

1-Year

3-Year

5-Year

10-Year

Since Inception (5/24/2001)

VTI

17.4%

24%

15.7%

14.7%

9.2%

Benchmark

17.4%

24.1%

15.7%

14.7%

9.2%

Data source: Vanguard.

As the chart shows, the fund’s returns have closely tracked those of the benchmark index it follows. That’s due to its ultra-low ETF expense ratio of 0.03%. At that rate, it would only cost you about $0.02 in management fees each year for every $60 you invest in the fund.

Broad exposure to the U.S. bond market

The Vanguard Total Bond Market Fund provides investors with broad exposure to the taxable investment-grade, U.S. dollar-denominated bond market. The fund holds high-quality bonds issued by the U.S. government, corporations, and foreign entities. It excludes tax-exempt bonds (e.g., municipal bonds), inflation-protected bonds (e.g., I-Bonds and TIPS), and non-investment-grade bonds (e.g., junk bonds).

This fund currently holds nearly 11,400 bonds with varying maturities (averaging over eight years) from numerous issuers, including U.S. Treasury securities, government-backed mortgages, corporations, and foreign entities.

Bonds provide investors with several benefits. They generate fixed income from bond interest payments (BND currently has a yield of more than 4%). They also help diversify a portfolio, thereby lowering its risk profile.

However, bonds do have much lower returns compared to stocks, especially in more recent decades due to lower interest rates:

Fund

1-Year

3-Year

5-Year

10-Year

Since inception (4/3/2007)

BND

2.9%

4.9%

-0.5%

1.8%

3.1%

Benchmark

2.9%

5%

-0.4%

1.9%

3.2%

Data source: Vanguard.

This ETF also does an excellent job of mirroring the returns of its benchmark, thanks to its ultra-low fees (0.03% ETF expense ratio). At that rate, you’d only pay $0.01 per year in fees for every $40 invested in the fund. The low fees enable investors to keep more of the interest income generated by the bonds held by the fund.

A great pairing

These two Vanguard ETFs complement each other well, offering a balanced approach between risk and reward. The Vanguard Total Stock Market ETF provides broad exposure to the U.S. stock market, while the Vanguard Total Bond ETF offers access to high-quality U.S. dollar bonds. This combination enables investors to participate in the growth of stocks while receiving income and stability from bonds. Investing $100 in these two Vanguard ETFs is a truly set-and-forget investment strategy.

Matt DiLallo has positions in Amazon, Apple, Meta Platforms, and Vanguard Total Bond Market ETF and has the following options: short November 2025 $260 calls on Apple. The Motley Fool has positions in and recommends Amazon, Apple, Meta Platforms, Microsoft, Nvidia, Vanguard Total Bond Market ETF, and Vanguard Total Stock Market ETF. The Motley Fool recommends the following options: long January 2026 $395 calls on Microsoft and short January 2026 $405 calls on Microsoft. The Motley Fool has a disclosure policy.

Source link

3 Monster Stocks to Buy and Hold for the Next 10 Years

If you’re planning to be a long-term holder, make sure its stocks like these with durable competitive advantages.

If you’re looking for some monster returns, the stocks that can provide them come in many shapes and sizes. For this exercise, we’re going to identify three stocks that show significant revenue growth as well as improving free cash flow and gross margins.

These indicators emphasize better financial health, flexibility for growth, or returning extra value to shareholders. Here’s a look at three companies with rising top lines, while simultaneously bringing more dollars to their bottom lines.

One seller’s trash, another buyer’s treasure

First up is a company called Copart (CPRT -0.33%), which operates an online salvage-vehicle auctions that 11 countries across North America, Europe, and the Middle East. Copart makes over 3.5 million transactions annually through its virtual bidding platform that connects vehicle sellers with over 750,000 registered buyers.

CPRT Chart

CPRT data by YCharts; TTM = trailing 12 months.

Copart has quickly grown into the largest online salvage-vehicle auction operator in the U.S. market and has grown its top line nearly fivefold since 2009 thanks to a strategy of land expansion and higher salvage volume. The company has contracts with large auto insurers, which have a plethora of vehicles deemed a total loss and sell them on consignment for high margins to dismantlers.

Automotive salvage yard.

Image source: Getty Images.

Copart has been expanding. It’s crucial for the company to have ample land capacity to handle an influx of salvage vehicles on short notice and has nearly tripled its acreage since 2015, with an emphasis on areas at high risk of natural disasters. It’s also expanding into the salvage-vehicle resale process with offerings such as vehicle title transfer and salvage estimation services.

The company is expanding its business and its top line and has durable competitive advantages with the land it owns, creating a high-liquidity marketplace for buyers and sellers that isn’t easily replicable.

A recurring revenue dream

Autodesk (ADSK -2.19%) is an application software company servicing industries that span architecture, engineering, construction, product design and manufacturing, media, and entertainment. The company essentially enables the design, rendering, and modeling needs of those industries and has over 4 million paid subscribers across 180 countries.

ADSK Chart

ADSK data by YCharts.

Autodesk, while providing leading industry computer-aided design software, drives its success and durable competitive advantages through switching costs and network effects, which actually tend to reinforce each other. Widespread training on its software, often early in careers, not only gives people familiarity with the software, it also makes the cost of learning a competing software undesirable, unproductive, and time-consuming.

Furthermore, according to Morningstar, over 95% of its revenue is now recurring after the company transitioned away from licenses to a subscription model over the better part of the last decade. The change should enable the company to drive its top line even higher as it extracts more revenue per user with upsells and a more mature and loyal user base.

Autodesk even has upside if it can capture a chunk of the estimated 12 million to 15 million people using pirated versions of its software.

A hotel for every need

As of the end of 2024, InterContinental Hotels Group (IHG -1.01%) operated nearly 990,000 rooms across 19 brands that span from midscale through luxury segments. Holiday Inn and Holiday Inn Express are its largest and most recognizable brands, but it also has an assortment of lesser-known lifestyle brands that are recording strong demand.

IHG Chart

IHG data by YCharts.

While there’s a bit of U.S. economic uncertainty in the near term, InterContinental should be able to leverage its strong brand of assets to drive room share (i.e., market share) over the next decade. It has renovated and newer brands focusing on attractive midscale and extended-stay segments, as well as a loyalty program with roughly 145 million members to help drive growth.

The company also holds significant assets in international markets with those outside of the Americas generating 47% of total rooms for 2024, and it’s well positioned for the more than 1 billion middle-income consumers expected to be joining the global population over the next 10 years.

The company has over 99% of rooms managed or franchised, which provides an attractive recurring-fee business model highlighted by high return on invested capital (ROIC) as well as high switching costs for property owners.

Contracts often last from 20 to 30 years, also providing noteworthy cancellation costs for owners — all helping drive durable competitive advantages for IHG.

Are they buys?

For long-term investors, these three potentially monster stocks have proved they can rapidly grow their top line while also improving gross margins and pushing more dollars into free cash flow.

The kicker is that all three possess some form of competitive advantage that should sustain and enable growth over the next decade. If you’re looking for market beating returns, these three stocks are a great place to start your research — and perhaps a small position.

Source link

Should You Buy Eaton Stock While It’s Below $400?

The company’s exposure to data center spending and the “electrification of everything” megatrend is exciting investors.

Eaton Corporation (ETN -2.15%) has garnered significant investor interest due to its exposure to the rapidly growing data center infrastructure market, and rightly so. Still, is it enough to justify the current valuation, and what do investors need to assume about the company’s growth prospects to buy the stock? Here’s the lowdown.

A valuation change

The change in investor sentiment toward Eaton is expressed in the chart below. Traditionally, electrical and power products companies were viewed as mature and relatively low-growth entities that struggled to expand beyond the confines of low-single-digit gross domestic product growth. As a rough rule of thumb, such companies in the industrial world are accorded a ratio of enterprise value (market cap plus net debt) to earnings before interest, taxation, depreciation, and amortization (EBITDA) of about 11 and/or a price-to-free-cash-flow ratio of about 20.

As you can see in the following chart, these valuations are mainly consistent with what Eaton previously traded at. However, in recent years, there has been a significant increase in the valuation investors are willing to pay.

ETN EV to EBITDA Chart

ETN EV to EBITDA data by YCharts.

Why investors view Eaton more favorably

The increase in valuation is due to the increase in its growth rate — in 2019, its three-year average revenue growth rate was 2.7% compared to 8.2% in 2024 — and the potential for growth stemming from its exposure to data centers, particularly in North America. The need for data centers is being largely driven by the increasing use of artificial intelligence (AI). The table below breaks out Eaton’s revenue by segment, illustrating the significant contribution of the Electrical Americas segment over the past few years.

Segment 

Operating Profit 2022

Operating Profit 2023

Operating Profit 2024

Share of Profit Increase From 2022 to 2024

Electrical Americas

$1,913 million

$2,675 million

$3,455 million

87.5%

Electrical Global

$1,134 million

$1,176 million

$1,149 million

0.9%

Aerospace

$705 million

$780 million

$859 million

8.7%

Vehicle

$453 million

$482 million

$502 million

2.8%

eMobility

($9) million

($21) million

($7) million

0.1%

Data source: Eaton SEC filings.

The growth in the Electrical Americas segment is expected to be driven by data centers in the near term, as they have now become Eaton’s second-largest end market by sales, with management estimating that data centers will be responsible for 17% of total revenue in 2025. Moreover, it’s reasonable to argue that its second-fastest growing end market, utilities (11% of revenue), is at least in part driven by demand for power from data centers.

In addition, Eaton is a beneficiary of the “electrification of everything” megatrend, with solid end demand from defense and aerospace (estimated to account for 6% of 2025 sales). It also has growth prospects in commercial aerospace (9%), given Boeing and Airbus‘ backlogs and plans to ramp up production.

An aerial view of an urban center like Manhattan with densely packed tall buildings.

Image source: Getty Images.

Is Eaton Stock a buy?

The growth case is compelling, and Wall Street analysts expect Eaton’s revenue to grow at a 9% compound annual growth rate (CAGR) to 2027, with earnings growing at a near 14% annual rate.

That being said, there are a few key considerations to keep in mind. First, data centers and utilities are expected to account for a combined 28% of revenue in 2025, and there’s no guarantee that the torrid rates of growth in AI-led data center spending will continue.

Second, as the table above indicates, its eMobility business (components for electric vehicles) is not currently profitable. Since management expects to grow at a double-digit rate to 2030, the vehicle business (internal combustion engine components) is only expected to grow by low single digits to 2030; it’s hard to see how this relative shift in automotive-related revenue won’t result in some margin pressure.

Third, the company’s valuation relative to non-pure play data center peers appears high. A stock like Vertiv might be a better fit for investors seeking a pure-play data center stock.

ETN EV to EBITDA Chart

ETN EV to EBITDA data by YCharts.

Trading at an EV/EBITDA of 19 using estimates for 2027 and at a price-to-free-cash-flow of 28.6 using 2027 estimates, Eaton looks like a fully valued stock because it will need more than a ramp-up in data center spending expectations before the stock seems like a good value.

Lee Samaha has no position in any of the stocks mentioned. The Motley Fool has no position in any of the stocks mentioned. The Motley Fool has a disclosure policy.

Source link

4 Healthcare Stocks to Buy Now

As investors crowd into AI names at record highs, these three healthcare stocks offer more compelling valuations.

Healthcare stocks have struggled since interest rates began climbing in 2022. Rising yields pulled capital away from speculative biotech and drug development, pushing valuations lower even as research pipelines advanced. Many promising companies now trade at a fraction of their previous highs, while investors pour money into artificial intelligence (AI) names trading at record multiples.

That gap creates opportunity. Several healthcare innovators are approaching pivotal stages of development, yet their share prices still reflect caution rather than potential. These four healthcare stocks stand out as timely buys in a market that has overlooked their progress.

A biotech researcher in a lab.

Image source: Getty Images.

Commercial momentum building

Crispr Therapeutics (CRSP -2.44%) and Vertex Pharmaceuticals (VRTX -1.68%) developed Casgevy, the first gene-editing treatment approved for sickle cell disease and beta-thalassemia, two inherited blood disorders.

Vertex reported $30 million in Casgevy sales in the second quarter of 2025, a sharp uptick from prior quarters, showing the drug is starting to gain traction in the marketplace. Crispr receives 40% of the program’s profits through its partnership with Vertex.

By mid-2025, 75 hospitals and clinics worldwide had been cleared to administer Casgevy, and approximately 115 patients had begun the treatment process. As more centers gain experience, patient numbers and sales are expected to grow through 2025 and 2026.

Outside of Casgevy, Crispr is working on several new treatments it fully owns, such as CTX112, a cell-based therapy in early testing for cancer and immune diseases. Results from CTX112 or other key pipeline candidates in late 2025 could provide a boost to the stock if the data show clear progress.

Late-stage catalysts approaching

Intellia Therapeutics (NTLA -3.81%) is advancing two CRISPR gene-editing programs toward key readouts. It recently completed enrollment in its Phase 3 study for hereditary angioedema, a rare disease that causes sudden swelling attacks, using a treatment called lonvoguran ziclomeran (NTLA-2002). Topline results are expected in the first half of 2026, with a regulatory filing planned later that year.

Intellia is also pushing forward with its program for ATTR amyloidosis, a disease in which abnormal proteins build up and damage the heart and nerves, using a treatment called nex-z (NTLA-2001). A pivotal trial is underway, and earlier testing showed that a single dose can reduce the TTR protein by approximately 91% in many patients, with data showing sustained reductions over time.

If both programs succeed, Intellia could become one of the first companies to win approval for a single-dose, in vivo CRISPR therapy (where gene editing happens directly inside the body) — a potential breakthrough that could lift investor expectations and reset how gene-editing companies are valued.

Platform plays with pharma validation

Recursion Pharmaceuticals (RXRX -10.24%) runs a drug discovery platform powered by AI and backed by big pharma partnerships such as Sanofi, Roche, and Bayer. In its latest results, the company pulled in $19.2 million in revenue — primarily from collaborations.

Several clinical trial updates are expected later in 2025. If those trials show its AI-discovered drugs perform well in patients, the market may begin valuing its individual programs more favorably — and that could unlock significant upside for the stock.

Viking Therapeutics (VKTX -4.00%) is advancing VK2735, a dual GLP-1/GIP agonist, through late-stage development for obesity. In its mid-stage study, the injectable version produced up to 14.7% average weight loss after 13 weeks and is now being tested in a large late-stage trial across obesity and type 2 diabetes populations.

The stock declined in August 2025 after results from the oral formulation showed higher dropout rates caused by gastrointestinal side effects from rapid dose escalation. The findings reflected how the drug was given, not an underlying problem with the compound.

With a slower titration schedule, tolerability could improve meaningfully. Both the injectable and oral versions remain key to Viking’s obesity strategy, positioning the company to compete in a market expected to exceed $100 billion in annual sales.

George Budwell has positions in CRISPR Therapeutics and Viking Therapeutics and has the following options: long January 2027 $100 calls on Viking Therapeutics and long January 2027 $60 calls on Viking Therapeutics. The Motley Fool has positions in and recommends CRISPR Therapeutics, Intellia Therapeutics, and Vertex Pharmaceuticals. The Motley Fool recommends Roche Holding AG and Viking Therapeutics. The Motley Fool has a disclosure policy.

Source link

If I Could Only Buy and Hold a Single Stock, This Would Be It

Alphabet is the one stock I’d own if I could only own one.

If I could only own one stock for the next decade, it would be Alphabet (GOOGL -2.05%) (GOOG -1.99%). The company has dispelled fears that artificial intelligence (AI) is a threat, while its biggest risk around its antitrust case is now behind it. Meanwhile, it probably has one of the best long-term growth setups of any stock out there.

Alphabet’s dominance starts with search. Google remains the front door to the internet for billions of people, and that’s not changing anytime soon due to the huge distribution advantage the company has. It controls both the world’s leading smartphone operating system and web browser in Android and Chrome, respectively, while its search revenue-sharing deal with Apple makes it the default search engine for Safari.

Artist rendering of a bull market.

Image source: Getty Images.

Meanwhile, Alphabet is now incorporating AI throughout Google to make its offering even stronger and help drive query growth. With new features like Lens and Circle to Search, Alphabet has found new ways to help people search instead of just typing in text. This is driving more queries, many of which have a shopping intent that feeds into its massive ad network. Meanwhile, AI Overviews and its new AI Mode, which lets users toggle between traditional results and chatbot-style answers, are also driving more engagement.

Google’s data advantage also shouldn’t be underestimated. The company has decades of user data, as well as videos through YouTube, that it can use to make its Gemini AI models better. Alphabet’s strength in multimodal AI is another area of strength that gets overlooked. The Gemini chatbot app has been taking off, largely due to Nano Banana, its newest AI image editor and creator, while Google Veo 3 is a video AI leader.

Alphabet has also spent decades creating one of the most wide-reaching ad networks on the planet. It can handle anything from global campaigns to local merchants. Creating great search and AI products is just half the battle; you need to be able to monetize them, and Alphabet’s unmatched ad network puts it light-years ahead of any emerging competition.

To the clouds and beyond

While search is Alphabet’s biggest business, it is far from a one-horse pony. Cloud computing has become the company’s fastest-growing business. Last quarter, Google Cloud revenue jumped 32% to $13.6 billion, while operating income more than doubled to $2.8 billion. Demand is so strong that Alphabet raised its 2025 capital expenditure (capex) budget by $10 billion to $85 billion to expand data center capacity. Unlike many peers, Google Cloud is vertically integrated from top to bottom. Google is the only company with its own world-class AI model and its own custom chips, called Tensor Processing Units (TPUs), that it’s using at scale. Those TPUs provide both cost and performance advantages, especially as workloads shift toward inference rather than training.

Alphabet is also taking AI deeper into the enterprise with its new Gemini Enterprise and Gemini Business subscriptions. These offerings let companies build and deploy AI agents without writing code. The launch includes pre-built agents and access to partner-built ones, all backed by enterprise-grade security features like Model Armor. This positions Google to compete directly with Microsoft and OpenAI for corporate AI spending, and early adopters such as Gap and Virgin Voyages are already reporting measurable productivity gains.

Behind all this, Google Cloud benefits from technology that’s hard to replicate. It developed Kubernetes, which is now the standard for containerized apps, and it owns one of the largest private fiber networks in the world, delivering low-latency performance on a global scale. Its pending acquisition of Wiz, meanwhile, will add a best-in-class cloud security platform. Google Cloud may be the third-largest cloud provider by market share, but its technology stack and integration with Gemini give it a differentiated position that could drive outsize growth over the next decade.

In addition to cloud computing, Alphabet also has some promising emerging bets. The one furthest along is Alphabet’s robotaxi unit Waymo, which is already operating in multiple U.S. cities and expanding rapidly. If it can lower costs, it could eventually become a huge profit driver for the company. The company’s quantum computing team, meanwhile, is also making real progress with its Willow chip, which has shown reduced error rates as it scales.

A cheap stock with big growth ahead

Despite all this, Alphabet’s valuation still looks attractive. The stock trades at a forward price-to-earnings (P/E) ratio of roughly 22.5 times projected 2026 earnings, which is a clear discount to its mega-cap AI peers. So, despite the rally in the stock this year, it still is not fully getting the respect it deserves.

Given its valuation, wide moat, growth prospects, and the optionality of its emerging bets in robotaxis and quantum computing, Alphabet is the one stock I’d own if I could only own one stock.

Source link

Trust Co Goes Big on Bonds With $15 Million BND Buy

Trust Co disclosed the purchase of 209,679 additional shares of Vanguard Bond Index Funds – Vanguard Total Bond Market ETF, estimated at $15.44 million (rounded from $15,439,353), in its SEC filing for the period ended September 30, 2025, submitted on October 6, 2025.

What happened

According to a filing with the Securities and Exchange Commission dated October 06, 2025, Trust Co increased its stake in Vanguard Bond Index Funds – Vanguard Total Bond Market ETF(BND 0.40%) by 209,679 shares during the quarter. The estimated value of shares acquired is $15.44 million, based on the average price for the period.

What else to know

The fund added to its BND position, which now represents 7.0660% of reportable assets under management.

Top holdings following the filing:

  • SHV: $84,464,498 (8.6% of AUM)
  • BND: $69.08 million (7.1% of AUM)
  • AGG: $66.39 million (6.8% of AUM)
  • VUG: $62,950,365 (6.4% of AUM)
  • VTV: $59,005,900 (6.0% of AUM)

BND’s trailing twelve-month dividend yield was 3.79% as of October 6, 2025.

Company overview

Metric Value
AUM N/A
Dividend Yield 3.79%
Price (as of market close October 3, 2025) $74.31
1-Year Price Change (0.44%)

Company snapshot

Vanguard Total Bond Market ETF (BND) tracks the performance of the broad U.S. investment-grade taxable bond market through a passively managed, index-sampling strategy.

Its portfolio includes U.S. government, corporate, mortgage-backed, and asset-backed securities with maturities over one year, providing diversified fixed income exposure.

The fund serves institutional and retail investors seeking broad, low-cost exposure to the U.S. bond market.

Vanguard Total Bond Market ETF (BND) is one of the largest fixed income ETFs, offering investors comprehensive access to the U.S. investment-grade bond universe.

Foolish take

Trust Co added $15.4 million worth of Vanguard Bond Index Funds – Vanguard Total Bond Market ETF. This addition increased it position to roughly 7% of total AUM, showing meaningful exposure.

As one of the largest bond ETFS, BND gives investors a one-stop exposure to the U.S bond market, spanning Treasuries, corporate bonds and mortgage backed securities. It is often used as a foundation for income-oriented portfolios that value stability and diversification.

The renewed demand for broad funds like BND reflects a shift from several years of stock-heavy market leadership. With interest rates still elevated, investors are finding value in locking in higher bond yields while they last. That makes funds like BND appealing again to both institutional and individual investors looking for steady returns.

For long term investors, adding BND can steady a portfolio while still collecting a reliable income stream. Its stability and diversification make it a solid foundation for any balanced portfolio.

Glossary

13F reportable assets:Assets that institutional investment managers must disclose quarterly to the SEC if they exceed $100 million.

AUM (Assets Under Management):The total market value of assets an investment manager handles on behalf of clients.

ETF (Exchange-Traded Fund):A fund that trades on stock exchanges and holds a diversified portfolio of securities.

Dividend yield:Annual dividends paid by an investment, expressed as a percentage of its current price.

Trailing twelve-month (TTM) dividend yield:Dividend yield calculated using dividends paid over the last twelve months.

Index-sampling strategy:A method where a fund holds a representative sample of securities from an index, not every component.

Investment-grade:Bonds rated as relatively low risk of default by credit rating agencies.

Fixed income:Investment securities that pay regular interest, such as bonds, providing predictable income streams.

Mortgage-backed securities:Bonds secured by a pool of mortgages, with payments passed through to investors.

Asset-backed securities:Bonds backed by pools of assets like loans, leases, or receivables, rather than mortgages.

Passively managed:An investment approach aiming to replicate the performance of a market index, with minimal trading.

Stake:The total ownership or holding an investor has in a particular security or fund.

Source link

Financial Management Company Douglas Lane Raised Its Thermo Fisher Stake. Is the Stock a Buy?

On October 10, 2025, wealth management company Douglas Lane & Associates disclosed a purchase of Thermo Fisher Scientific valued at approximately $7.79 million, based on the average price for Q3 2025.

What happened

According to a filing with the Securities and Exchange Commission (SEC) dated October 10, 2025, Douglas Lane & Associates increased its position in Thermo Fisher Scientific (TMO -1.85%) by 16,745 shares during the quarter. The estimated transaction value was $7.79 million, based on the average closing price for the quarter. The fund now holds 216,276 shares after the trade.

What else to know

Following the purchase, Thermo Fisher Scientific represented 1.5% of the fund’s reportable assets under management as of September 30, 2025.

Top holdings after the filing are as follows:

  • NASDAQ:NVDA: $312.46 million (4.4% of AUM) as of September 30, 2025
  • NASDAQ:GOOG: $212.16 million (3.0% of AUM) as of September 30, 2025
  • NYSE:JPM: $203.56 million (2.8% of AUM) as of September 30, 2025
  • NASDAQ:MSFT: $184.79 million (2.6% of AUM) as of September 30, 2025
  • NASDAQ:QCOM: $167.31 million (2.3% of AUM) as of September 30, 2025

As of October 9, 2025, Thermo Fisher shares were priced at $534.68, and were down about 12% over the trailing 12 months.

Company Overview

Metric Value
Revenue (TTM) $43.21 billion
Net Income (TTM) $6.58 billion
Dividend Yield 0.32%
Price (as of market close 2025-10-09) $534.68

Company Snapshot

Thermo Fisher Scientific offers life sciences solutions, analytical instruments, specialty diagnostics, laboratory products, and biopharma services with revenue streams diversified across research, diagnostics, and pharmaceutical sectors.

The company operates a multi-segment business model, generating revenue through direct sales, e-commerce, and third-party distribution of proprietary products, consumables, and services. It serves pharmaceutical and biotechnology companies, clinical and research laboratories, academic institutions, government agencies, and industrial customers globally.

A scientist takes notes while working in a laboratory.

IMAGE SOURCE: GETTY IMAGES.

Thermo Fisher Scientific is a global leader in scientific instrumentation, diagnostics, and laboratory services, with a broad portfolio that supports research, healthcare, and biopharmaceutical production. The company leverages scale and a diverse product offering to drive consistent revenue growth, and serve a wide range of end markets.

Foolish take

Douglas Lane upping its Thermo Fisher Scientific holdings is noteworthy in that the wealth management company already had a substantial stake. This move suggests Douglas Lane believes Thermo Fisher stock remains attractively valued, especially after its decline over the last 12 months.

Indeed, looking at Thermo Fisher stock’s price-to-earnings (P/E) ratio shows it’s lower than it was a year ago. This indicates shares are a better value now, although the earnings multiple is not as low as it was after President Trump’s new tariff policies caused the entire stock market to fall last April.

As far as its business performance, Thermo Fisher is doing well. It achieved 3% revenue growth to $10.9 billion in its fiscal second quarter, ended June 28. The company did an outstanding job managing its expenses, and combined with its sales growth, allowed Thermo Fisher to deliver a 6% year-over-year increase in fiscal Q2 diluted earnings per share (EPS) to $4.28. This continues the trend of rising EPS exhibited over the last couple of years.

On top of that, Thermo Fisher raised its 2025 fiscal guidance to sales of about $44 billion. This would be a jump up from the prior year’s $42.9 billion. With rising revenue and EPS combined with a reasonable P/E ratio, Thermo Fisher stock looks like a compelling buy.

Glossary

Assets Under Management (AUM): The total market value of investments managed by a fund or investment firm.
13F Reportable Assets: Securities that institutional investment managers must disclose in quarterly SEC filings if they exceed $100 million in assets.
Alpha: A measure of an investment’s performance relative to a benchmark index, often indicating excess return.
Quarter: A three-month period used by companies for financial reporting and performance measurement.
Proprietary Products: Goods or services owned and produced exclusively by a company, often protected by patents or trademarks.
Consumables: Products intended for single or limited use, requiring regular replacement in laboratory or industrial settings.
Direct Sales: Selling products or services directly to customers without intermediaries or third-party distributors.
Third-Party Distribution: The sale of products through external companies or intermediaries rather than directly from the manufacturer.
Dividend Yield: The annual dividend payment expressed as a percentage of the stock’s current price.
Biopharma Services: Specialized services supporting the development and manufacturing of biopharmaceutical drugs.
End Markets: The final industries or customer segments that purchase and use a company’s products or services.
TTM: The 12-month period ending with the most recent quarterly report.

JPMorgan Chase is an advertising partner of Motley Fool Money. Robert Izquierdo has positions in Alphabet, JPMorgan Chase, Microsoft, Nvidia, and Qualcomm. The Motley Fool has positions in and recommends Alphabet, JPMorgan Chase, Microsoft, Nvidia, Qualcomm, and Thermo Fisher Scientific. The Motley Fool recommends the following options: long January 2026 $395 calls on Microsoft and short January 2026 $405 calls on Microsoft. The Motley Fool has a disclosure policy.

Source link

Financial Services Company Wealth Oklahoma Began Investing in Allison Transmission. Is the Stock a Buy?

The former Stolper Co is a financial management company that merged with another financial services business to form Wealth Oklahoma in 2025. It initiated a new position in Allison Transmission Holdings (ALSN -2.01%), acquiring 75,606 shares in the third quarter, an estimated $6.4 million trade based on the average price for Q3 2025, according to its October 10, 2025, SEC filing.

What happened

Wealth Oklahoma disclosed the purchase of 75,606 shares of Allison Transmission Holdings in its quarterly report filed with the U.S. Securities and Exchange Commission on October 10, 2025 (SEC filing). The new holding was valued at $6.4 million as of Q3 2025, with the transaction representing 1.9% of Stolper’s $330 million in reportable U.S. equity assets.

What else to know

This is a new position; the stake now accounts for 1.9% of Wealth Oklahoma’s 13F reportable assets as of September 30, 2025.

Top holdings after the filing are as follows:

  • BRK-B: $18.96 million (5.75% of AUM) as of 2025-09-30
  • JPM: $17.74 million (5.37% of AUM) as of 2025-09-30
  • AAPL: $14.90 million (4.52% of AUM) as of 2025-09-30
  • GOOGL: $11.92 million (3.6% of AUM) as of 2025-09-30
  • COF: $10.73 million (3.25% of AUM as of Q3 2025)

As of October 9, 2025, Allison Transmission shares were priced at $81.02, down 18.4% over the prior year ending October 9, 2025 and underperforming the S&P 500 by 33.9 percentage points over the past year.

The company reported trailing 12-month revenue of $3.2 billion for the period ended June 30, 2025 and net income of $762 million for the period ended June 30, 2025.

Allison Transmission’s dividend yield stood at 1.3% as of October 10, 2025. Shares were 35% below their 52-week high as of October 9, 2025.

Company Overview

Metric Value
Revenue (TTM) $3.20 billion
Net Income (TTM) $762.00 million
Dividend Yield 1.33%
Price (as of market close 10/09/25) $81.02

Company Snapshot

Allison Transmission designs and manufactures fully automatic transmissions and related parts for commercial, defense, and specialty vehicles. It also offers remanufactured transmissions and aftermarket support.

The company generates revenue primarily through product sales to original equipment manufacturers and aftermarket services, including replacement parts and extended coverage.

Allison Transmission serves a global customer base of OEMs, distributors, dealers, and government agencies, with a focus on commercial vehicle and defense markets.

A trucker sits in his big rig cab.

Image source: Getty Images.

Allison Transmission is a leading provider of fully automatic transmissions for medium- and heavy-duty commercial and defense vehicles worldwide. The company leverages a broad distribution network and long-standing OEM relationships to maintain a strong position in the auto parts sector.

Foolish take

Founded in 1915, Allison Transmission is a veteran of propulsion systems technology. It’s the world’s largest manufacturer of medium and heavy-duty fully automatic transmissions, according to the company.

Allison Transmission’s sales are down slightly year over year. Through the first half of 2025, revenue stood at $1.58 billion compared to $1.61 billion in 2024.

This lack of sales growth is a contributor to the company’s share price decline, adding to its dismal 2025 outlook, which it slashed due to softness in demand in some of its end markets, such as for medium-duty trucks. Allison Transmission now expects 2025 revenue to come in between $3.1 billion to $3.2 billion, down from $3.2 billion to $3.3 billion.

With Allison Transmission shares hovering around a 52-week low, Wealth Oklahoma took advantage to initiate a position in the stock. This speaks to Wealth Oklahoma’s belief that Allison Transmission can bounce back. This might be the case, given Allison’s recent acquisition of Dana Incorporated, which provides drivetrain and propulsion systems in over 25 countries.

With a price-to-earnings ratio of 9, Allison Transmission’s valuation looks attractive, which also explains Wealth Oklahoma’s purchase. The stock certainly looks like it’s in buy territory.

Glossary

13F reportable assets: U.S. equity holdings that institutional investment managers must disclose quarterly to the SEC on Form 13F.
AUM (Assets Under Management): The total market value of investments managed on behalf of clients by a financial institution or fund manager.
Dividend yield: Annual dividend payments divided by the share price, expressed as a percentage, showing income return on investment.
Trailing twelve months (TTM): The 12-month period ending with the most recent quarterly report.
Original equipment manufacturer (OEM): A company that produces parts or equipment that may be marketed by another manufacturer.
Aftermarket services: Products and support provided after the original sale, such as replacement parts, maintenance, or extended warranties.
Stake: The amount or percentage of ownership an investor or institution holds in a company.
Quarterly report: A financial statement filed every three months, detailing a company’s performance and financial position.
Distribution network: The system of intermediaries, such as dealers and distributors, through which a company sells its products.
Defense market: The sector focused on supplying products and services to military and government defense agencies.

JPMorgan Chase is an advertising partner of Motley Fool Money. Robert Izquierdo has positions in Alphabet, Apple, and JPMorgan Chase. The Motley Fool has positions in and recommends Alphabet, Apple, and JPMorgan Chase. The Motley Fool recommends Allison Transmission and Capital One Financial. The Motley Fool has a disclosure policy.

Source link

Investment Company Luminus Loaded Up on This Leading Industrials Stock. Is It a Buy?

Luminus Management disclosed the purchase of 87,120 shares of Kirby Corporation (KEX -2.17%), with an estimated transaction value of $8.8 million in an Oct. 3 SEC filing.

What happened

According to the Oct. 3 filing with the Securities and Exchange Commission, Luminus Management increased its stake in Kirby Corporation by over 87,000 shares during the third quarter of 2025. The estimated trade value is $8.75 million, based on the average closing price for the quarter. Following the transaction, the fund holds 116,956 shares valued at $9.8 million as of September 30, 2025.

What else to know

Luminus Management’s increase in its Kirby stake means that stock now comprises 8.8% of reported AUM as of September 30, 2025.

Top holdings after the filing are:

  • NYSE:CC: $27.96 million (25.1% of AUM) as of September 30, 2025
  • NYSE:OI: $26.53 million (23.8% of AUM) as of September 30, 2025
  • NYSE:SEE: $17.65 million (15.9% of AUM) as of September 30, 2025
  • NYSE:KEX: $9.76 million (8.8% of AUM) as of September 30, 2025
  • NYSE:KWR: $7.97 million (7.1603% of AUM) as of September 30, 2025

As of October 2, 2025, Kirby shares were priced at $83.71, down 31.8% over the past year, underperforming the S&P 500 by 49.3 percentage points over the past year.

Company Overview

Metric Value
Price (as of market close 2025-10-02) $83.71
Market Capitalization $4.63 billion
Revenue (TTM) $3.27 billion
Net Income (TTM) $303.05 million

Company Snapshot

Kirby Corporation is a leading U.S. marine shipping and services company with significant scale in tank barge transportation and industrial equipment distribution. Its integrated business model leverages a large fleet and technical expertise to support critical supply chains for energy and industrial customers. The company’s broad service offering and national footprint provide a competitive edge in reliability and operational reach.

A barge carrying cargo heads away from a port.

Image source: Getty Images.

Kirby provides marine transportation of bulk liquid products, including petrochemicals, black oil, refined petroleum products, and agricultural chemicals. It also offers after-market services, parts, and equipment for engines, power systems, and oilfield applications.

The company generates revenue through barge and towing operations across U.S. inland and coastal waterways, as well as through distribution, servicing, and manufacturing of specialized industrial and energy equipment.

Kirby serves industrial customers in the petrochemical, oil refining, and agricultural sectors, along with U.S. government entities.

Foolish take

Luminus Management is an investment company focused on the energy and chemical sectors. Its stake in the Kirby Corporation aligns with this focus, since Kirby is a leading provider of marine transportation for the energy and petrochemical industries.

Luminus added to its existing Kirby position in a big way. The investment company previously held less than 30,000 shares. Now, that number is north of 116,000, demonstrating a belief the stock is destined for upside after Kirby shares dropped over 30% in the trailing 12 months. The stock hovers around a 52-week low as of Oct. 10.

The share price decline is understandable. Through the first half of 2025, Kirby’s sales of $1.6 billion were flat compared to 2024. Harsh winter weather conditions during the first quarter, and an uncertain macroeconomic environment on the trade policy front, cut into demand for the company’s services, resulting in lackluster sales.

However, Kirby management expects to end 2025 with a 15% to 25% year-over-year increase in earnings. Its net earnings through two quarters are up around 10%. If it misses this earnings goal, Kirby shares could sink further than it already has this year. So while the share price decline looks like a buy opportunity given Kirby’s leadership in the marine transport space, investing in the stock holds some risk.

Glossary

13F reportable AUM: Assets under management that must be disclosed by institutional investment managers in quarterly SEC Form 13F filings.
AUM (Assets Under Management): The total market value of investments managed on behalf of clients by a fund or firm.
Quarterly average price: The average price of a security over a specific three-month period, often used to estimate transaction values.
Post-trade position: The total holdings of a security after the most recent buy or sell transaction is completed.
Filing: An official document submitted to a regulatory authority, such as the SEC, disclosing financial or operational information.
Tank barge transportation: The movement of bulk liquid cargo using specialized flat-bottomed vessels on inland or coastal waterways.
Distribution (in industrial context): The sale and delivery of products, parts, or equipment to customers or service providers.
After-market services: Support, maintenance, and parts provided for equipment after its initial sale.
Integrated business model: A strategy where a company controls multiple stages of its supply chain or service process.
National footprint: The presence and operational reach of a company across multiple regions or the entire country.
TTM: The 12-month period ending with the most recent quarterly report.

Source link

Big Money Move: NextEra Energy Soars to Fund’s Top Holding After $4 Million Buy, According to Recent Filing

Ausbil Investment Management Ltd disclosed a purchase of approximately $4.31 million in NextEra Energy (NEE -0.50%) shares, according to an SEC filing for the period ended September 30, 2025.

What Happened

According to a filing with the Securities and Exchange Commission dated October 08, 2025, Ausbil increased its position in NextEra Energy by 58,977 shares during the quarter. The fund held 140,270 shares, worth $11.04 million as of quarter-end.

What Else to Know

Fund bought shares, bringing its NextEra Energy stake to 5.9% of reportable AUM

Top holdings after the filing:

  • NEE: $11.04 million (5.9% of AUM) as of September 30, 2025
  • NSC: $10.08 million (5.4% of AUM) as of September 30, 2025
  • CSX: $10.06 million (5.4% of AUM) as of September 30, 2025
  • LNG: $7.71 million (4.1% of AUM) as of September 30, 2025
  • ES: $7.32 million (3.9% of AUM) as of September 30, 2025

As of October 8, 2025, shares were priced at $84.04, up 4.4% in the past year, underperforming the S&P 500 by 10.65 percentage points over the same period.

Company Overview

Metric Value
Revenue (TTM) $25.90 billion
Net Income (TTM) $5.92 billion
Dividend Yield 2.64%
Price (as of market close 10/08/25) $84.04

Company Snapshot

NextEra Energy generates, transmits, and distributes electric power through wind, solar, nuclear, coal, and natural gas facilities, with a growing portfolio in renewable energy and battery storage projects.

The company operates a regulated utility business and develops long-term contracted clean energy assets, earning revenue primarily from electricity sales and energy infrastructure services.

It serves about 11 million people through roughly 5.7 million customer accounts on the east and lower west coasts of Florida as of December 31, 2021.

NextEra Energy, Inc. is a leading North American utility and renewable energy provider with significant scale and a diversified generation portfolio. Its strategic focus on renewables and grid modernization positions it as a key player in the transition to sustainable energy.

Foolish Take

Ausbil Investment Management’s decision to acquire more than $4.3 million worth of NextEra Energy stock looks like a big bet on a stock that has underperformed the benchmark S&P 500 over the last year. Bear in mind, following this purchase, NextEra Energy is now Ausbil’s largest single position. The stock now represents nearly 6% of its total AUM, meaning the portfolio managers have strong conviction in NextEra’s potential.

Nevertheless, NextEra’s three-year performance isn’t anything to write home about. Shares have generated a three-year total return of only 18%, which equates to a compound annual growth rate (CAGR) of 5.8%. Meanwhile, the S&P 500 has generated a total return of 90% over that same period and a CAGR of 23.8%.

In other words, this is a notable buy, as it shows at least one large institutional money manager is making a significant bet on NextEra stock. Given the company’s key role within the North American utility industry and its focus on renewables and sustainable energy, investors who are seeking exposure to the utility sector may be well served by giving NextEra stock a closer look.

That said, NextEra’s chronic underperformance versus the S&P 500 should also be taken into account. No institutional move should ever be the sole reason for buying or selling a stock, and while this move is significant, NextEra stock still has much to prove.

Glossary

13F reportable AUM: Assets under management reported by institutional investment managers on SEC Form 13F, covering certain U.S. securities.
Dividend Yield: Annual dividends per share divided by the share price, expressed as a percentage.
Regulated utility: A utility company whose rates and operations are overseen by government agencies to protect consumers.
Long-term contracted clean energy assets: Renewable energy projects with multi-year agreements to sell electricity at set prices.
Grid modernization: Upgrading electric power infrastructure to improve reliability, efficiency, and support for renewable energy.
Battery storage projects: Facilities that store electricity for later use, helping balance supply and demand on the grid.
Stake: The ownership interest or shareholding an investor holds in a company.
Trailing the S&P 500: Underperforming the S&P 500 index over a specified period.
TTM: The 12-month period ending with the most recent quarterly report.
Quarter-end: The last day of a fiscal quarter, used for financial reporting and valuation.
Contracted revenue: Income guaranteed by signed agreements, often over multiple years.

Jake Lerch has positions in Norfolk Southern. The Motley Fool has positions in and recommends Cheniere Energy and NextEra Energy. The Motley Fool has a disclosure policy.

Source link

3 Brilliant but Overlooked Driverless Vehicle Stocks to Buy and Hold for 10 Years

If you’re looking for hidden gems that could return significant value as driverless vehicles take over roads, start here.

Like it or not, and whether we trust driverless vehicles yet or not, they’re on the way, and the future is coming faster than many investors realize. The driverless vehicle market has enormous growth potential and is projected to be worth trillions of dollars in a decade’s time.

Don’t take it from me: Goldman Sachs Research predicts that robotaxis’ ride-share market alone is on the path for a 90% compound annual growth rate between 2025 and 2030, and that’s merely scratching the surface. If you’re looking to dip your toes into what could be a generational investing opportunity, here are three stocks to keep an eye on.

One way to play robotaxis

Mobileye Global (MBLY -6.56%) is in the business of developing and deploying Advanced Driver Assistance Systems (ADAS) and autonomous driving technologies and solutions. With a comprehensive collection of software and hardware technologies, Mobileye can offer end-to-end products and services for automakers. Investors should look at Mobileye as a solid robotaxi investment for those who don’t want to deal with the drama currently surrounding Tesla.

With the automotive industry heading toward driverless vehicles, Mobileye’s technology and systems will bolster automotive safety, productivity, and vehicle utilization through solutions such as Supervision, Chauffeur, Drive, and EyeQ. Meanwhile, management has been working hard to secure new ADAS deals with large customers, while finding new opportunities with untapped clients. One driving force for the company is a growing adoption of multicamera setups due to the need for increased safety and a push toward hands-free highway driving.

Adding to Mobileye’s growth is its strategic partnerships, including ZEEKR, using Mobileye as its launch partner for its ADAS, and its design wins with automakers such as Porsche and Mahindra, among other major OEMs. Just this spring, Volkswagen announced a collaboration with Mobileye to improve safety and driving comfort for some of its upcoming vehicle pipeline.

The company remains unprofitable, with full-year guidance expecting an operating loss between $436 million to $512 million. That said, Mobileye boasts roughly $1.7 billion in cash and cash equivalents, rising free cash flow, very little debt, and should be able to navigate choppy waters as the industry slowly figures out the path to full autonomous vehicles.

The business of connectivity

Aptiv PLC (APTV -2.47%) is a technology company working to bring the next generation of active safety, autonomous vehicles, smart cities, and connectivity through its decades of experience pioneering advances in the automotive industry.

While the stock has faltered from its all-time highs as electric vehicle hype died down with slower-than-anticipated adoption in the U.S. market, it’s still performing well, with earnings expected to check in at $7.48 per share in 2025, up significantly from $2.61 in 2021 — a compound annual growth rate of 30%.

Aptiv sensors graphic.

Image source: Aptiv.

But its growth prospects might improve even more, with the company’s business split on the horizon for the first quarter of 2026. Aptiv plans to split into two companies: one that will focus on slower-growth electrical distribution systems (EDS), and the second on faster-growth safety and software — the latter aimed at a more driverless vehicle focus.

It’s easy to understand the rationale behind the business breakup when you consider the EDS business generated 2024 sales of $8.3 billion at earnings before interest, taxes, depreciation, and amortization (EBITDA) profit margins of 9.5%, while the safety and software generated 2024 sales of $12.2 billion with EBITDA margins nearly double at 18.8%.

The new Aptiv with a focus on safety and software that enable higher levels of autonomous functions won’t be limited to vehicles either, with potential applications for planes and other machines. Aptiv has already begun branching out its overall business with its communications software acquisition of Wind River in 2022.

All things autonomous

Hesai Group (HSAI -11.13%) is a global leader in lidar solutions, with its products enabling a wide range of applications including passenger and commercial vehicles ADAS, autonomous vehicles, robotics, and nonautomotive applications such as last-mile delivery robots.

Throughout the company’s second quarter, Hesai secured a notable number of new design wins through 2026, with 20 models from nine leading OEMs, highlighted by a platform win for multiple 2026 models with one of its top two ADAS customers. The design wins help cement lidar as a standard feature across the specific customer’s model lineups and will drive the company’s order book higher in the near term.

Outside its automotive wins, the company’s robotics business is also doing well, ranking No. 1 in lidar shipments in China for the first half of 2025, per Gaogong Industry Research Institute. Its robotics business is well positioned for the wave of physical artificial intelligence (AI), with lidars becoming essential for AI to perceive and sort the dynamic world we operate in, especially in driverless vehicles.

“In the first six months of 2025, total shipments have already surpassed those of full-year 2024. According to Gasgoo, we ranked first in installation volume among long-range lidar suppliers during this period,” said Hesai cofounder and CEO Yifan “David” Li in a press release.

Are the stocks buys?

The number of robotaxis and driverless vehicles on the roads is set to increase in the coming years, especially as leading autonomous vehicle operators reduce costs and begin scaling the business. Right now, roughly 1,500 such vehicles operate across a handful of U.S. cities, but that figure is expected to soar to about 35,000 across the country in 2030.

Even then, driverless vehicles will represent a fraction of the rideshare market, leaving plenty of long-term growth for investors who believe these companies have injected their technologies and solutions into the industry. Mobileye, Aptiv, and Hesai are all proven companies with products poised to push the boundaries of driverless vehicles, robotaxis, and ADAS going forward, and savvy investors would be wise to keep them on a watch list.

Source link

The Best Dividend ETF to Buy as Washington Stalls

Shutdowns happen, but markets hold up. This ETF will help you ride it out.

Even though we’ve been through this before, the U.S. government shutdown can be an unsettling time. Swaths of federal employees are off the job — or still working but not being paid — and it’s unclear how long the deadlock will last.

At the same time, it’s scary for non-government workers, too. We rely on the government for Social Security checks, Medicare, Medicaid, veterans’ benefits, and for much-needed services such as air traffic control.

People will still get their checks and veterans’ benefits, but some services will be delayed. And travelers are already reporting delays and cancelled flights at airports.

Fortunately, the stock market has a history of holding its own during a government shutdown. Keeping your money in the market has traditionally been a smart move. And if you’re worried about making sure you have a steady flow of income, a dividend exchange-traded fund (ETF) like the Vanguard Dividend Appreciation ETF (VIG -1.92%) can be a good option.

Mount Rushmore with a fence and a

Image source: Getty Images.

About the Vanguard ETF

First, it’s important to understand why the Vanguard Dividend Appreciation ETF includes the stocks it does. And to do that, you have to understand the principles of the underlying index, which is the Nasdaq US Dividend Achievers Select Index.

This index includes companies that are on the Nasdaq US Broad Dividend Achievers Index, with some important exceptions. First, it excludes the top 25% of companies in the index by dividend yield. That’s to make sure the Nasdaq US Dividend Achievers Select Index doesn’t have unstable companies with dividends that are artificially high because their businesses are unstable.

And second, the fund excludes all master limited partnerships and real estate investment trusts. Lastly, it only includes companies that have increased their dividend annually for at least 10 consecutive years.

The stocks left make up the Nasdaq US Dividend Achievers Select Index, and those names are skewed toward the technology, industrial, and financial sectors, which account for a collective 64% of the fund.

That’s the index that the Vanguard ETF strives to duplicate, so you can find the same breakdown by stock and sector in it. The top 10 holdings are all blue chip names, with no stock having more than a 6% weighting.

Holding

Portfolio Weight

1-Year Return

Dividend Yield

Broadcom

5.95%

91.2%

0.70%

Microsoft

4.8%

27.8%

0.69%

JPMorgan Chase

4%

49%

1.95%

Apple

3.7%

13.6%

0.41%

Eli Lilly

2.8%

-4.1%

0.71%

Visa

2.7%

26.5%

0.67%

ExxonMobil

2.4%

-5.3%

3.47%

Mastercard

2.3%

16.9%

0.52%

Johnson & Johnson

2.1%

20.5%

2.75%

Walmart

2%

28%

0.91%

Source: Morningstar

Only two of these companies in the Vanguard Dividend Appreciation ETF’s top 10 are in the red after 12 months. That’s the beauty of an ETF: Rather than trying to guess the one or two best stocks to buy, you get an entire bushel of them with the Vanguard ETF.

The other thing I really like about this ETF is that it gives you a good mix of performance and yield. Compared to some other popular dividend ETFs, it provides the best one-year performance, with a gain of 10%. Combine that with a dividend yield of 1.6%, and you get a nice total return from Vanguard Dividend Appreciation.

VIG Chart

VIG data by YCharts.

The bottom line

Yes, this can be an unsettling time, and it’s only natural to make sure that you’re investing in a fund that can provide you with some guaranteed quarterly income, especially if you’re worried that you’re going to have to cover a shortfall by another source.

The Vanguard Divided Appreciation ETF provides the best combination of dividend payout and one-year performance. And when you also consider that it has a low expense ratio of only 0.05%, or $5 annually per $10,000 invested, then I’m comfortable parking funds here while waiting for the government to restart.

JPMorgan Chase is an advertising partner of Motley Fool Money. Patrick Sanders has no position in any of the stocks mentioned. The Motley Fool has positions in and recommends Apple, JPMorgan Chase, Mastercard, Microsoft, Vanguard Dividend Appreciation ETF, Vanguard Whitehall Funds-Vanguard High Dividend Yield ETF, Visa, and Walmart. The Motley Fool recommends Broadcom and Johnson & Johnson and recommends the following options: long January 2026 $395 calls on Microsoft and short January 2026 $405 calls on Microsoft. The Motley Fool has a disclosure policy.

Source link

Should You Buy XRP While It’s Under $4?

This coin has a very long runway for growth, and it’s making inroads.

Today, XRP (XRP -13.05%) is priced at about $3. Depending on your perspective, that number could sound high or low. So is it worth buying the coin before it hits $4, and does it actually have a realistic chance of doing that?

Let’s dive in and figure it out.

One investor sits and another investor stands while the sitting investor consults four screens displaying stock price data.

Image source: Getty Images.

Why the sub-$4 range is attractive

XRP’s recent price means that getting to $4 is not going to take a moonshot. Considering that the coin is up by 34% this year so far, it might even hit the target before the end of the year if its momentum picks up steam. But let’s zoom out to look at the trends that are likely to power further demand.

On that front, real-world asset (RWA) tokenization is the process of representing ownership of assets like stocks, commodities, and real estate in a crypto token managed on a blockchain so that they can be cheaply and quickly transferred or traced. Across public chains, tokenized RWAs are worth $33.5 billion and still climbing, so this is not just a fad anymore.

So where does the XRP Ledger (XRPL) fit? The XRP Ledger’s RWA footprint has been expanding quickly, with roughly $365 million in tokenized assets, up 12% during the 30-day period ended Oct. 8. Its roster of RWAs now includes notable asset platforms and issuers you would recognize from institutional investor circles.

In particular, U.S. Treasuries are the on-chain beachhead for financial institutions, and XRP is starting to have them in spades, with $170 million in value parked today, up by an impressive 26% during the past 30 days alone. And, critically, Ripple’s enterprise-targeted stablecoin, RLUSD (RLUSD -0.04%), launched on the XRPL with regulatory approval in December 2024, giving XRPL a native settlement rail that institutions can actually use alongside those Treasuries. RLUSD’s market cap is more than $791 million today, with its monthly transfer volume at roughly $5.3 billion and rising rapidly month over month.

Those assets make the XRPL a much better place to do business for the financial institutions that are looking to manage their capital and process their transactions on-chain. When paired with Ripple’s good relationships with international banks and currency exchange houses, it’s a strong cocktail of positive forces for further adoption of XRP as a financial tool.

In other words, big pipes for money are being laid right where and how the holders of large volumes of capital prefer to do business. If that process continues — and Ripple is deeply invested in making sure that it does — the sub-$4 window for XRP will feel like an obvious purchase in hindsight.

What could go wrong

XRP is thus worth buying while it’s less than $4. But that does not guarantee it will get there or that its price will subsequently go even higher if it does. A few things need to happen for the coin’s upward march to continue.

First, the XRPL’s systems and capabilities must continue growing, and Ripple’s marketing efforts must keep succeeding broadly. That means getting more RWA issuers opting in, larger portfolios of tokenized treasuries and funds, and deeper integrations that reduce operational drag for the regulatory compliance teams at big banks and asset managers.

Second, RLUSD adoption needs to broaden so that more institutional flows settle on XRPL rather than detouring to other rails where liquidity is deeper. Ripple has been explicit about building toward lending, identity verification, and other features to simplify the process of doing regulatory-compliant tokenization, but it needs to maintain its consistent execution for the chain to continue being successful.

Assuming those tailwinds persist, getting XRP from roughly $3 to $4 and beyond is very doable, particularly in a market cycle where broader crypto risk appetite remains positive.

Alex Carchidi has no position in any of the stocks mentioned. The Motley Fool has positions in and recommends XRP. The Motley Fool has a disclosure policy.

Source link

The Smartest Growth Stock to Buy With $200 Right Now

This growth stock is a no-brainer buy if you have $200 to spare right now.

Buying and holding solid growth stocks for a long time is a tried and tested way of making money in the stock market. This philosophy not only allows investors to capitalize on disruptive and secular growth trends but also helps them benefit from the power of compounding.

Nvidia (NVDA -4.84%) is a classic example of what a smart growth stock can do for your portfolio. Anyone who bought just $200 worth of this semiconductor stock five years ago is now sitting on massive gains, as that investment is now worth $2,700. Nvidia is still a solid investment despite such outstanding growth in recent years.

Shares of Nvidia are now trading under $200 each (at around $185 as of this writing), thanks to the stock splits executed by the company in recent years. So if you have just $200 in investible cash, buying Nvidia with that money could turn out to be a smart move. Let’s look at the reasons why.

Nvidia’s AI-fueled growth isn’t going to stop anytime soon

Artificial intelligence (AI) has been the single most important catalyst for Nvidia’s surge. As the world was wowed by the abilities of OpenAI’s ChatGPT in November 2022, Nvidia’s graphics processing units (GPUs) were working behind the scenes to train the large language model (LLM) powering the chatbot.

Since then, LLMs have been deployed for building not just chatbots, but also for other tasks such as language translation, text generation, text summarization, image generation, writing code, automating workflows, and content creation, among other things. Businesses and governments are using the help of AI models to improve their efficiency and productivity.

Nvidia is at the center of this AI revolution because its GPUs have been the go-to choice for hyperscalers and cloud infrastructure providers looking to tackle AI workloads. This is evident from Nvidia’s commanding share of 92% in AI data center GPUs. Of course, competition from the likes of Broadcom and AMD could be a thorn in Nvidia’s side in the future, but there is ample opportunity for all the players in the AI chip market to make a lot of money in the coming years.

Citigroup estimates that AI infrastructure spending by major technology companies is likely to exceed $2.8 trillion through 2029, with half of that spending expected to take place in the U.S. itself. That’s a big jump from the investment bank’s earlier forecast of $2.3 trillion. This massive spending is going to be fueled by the growth in AI compute demand.

The enterprise and sovereign demand for AI compute has been robust. According to a survey conducted by the Federal Reserve Bank of St. Louis, workers using generative AI applications are 33% more productive each hour. 

Cloud computing capacity available at major hyperscalers and other infrastructure providers is greatly outpaced by demand. Oracle, Amazon, Microsoft, Alphabet, and others are sitting on massive revenue backlogs of more than $1 trillion. So it can be safely said that AI spending over the next four years has the potential to hit Citigroup’s $2.8 trillion mark.

Nvidia is expected to generate $206.4 billion in revenue in the current fiscal year, an increase of 58% from the previous year. So the company still has a lot of room for growth considering that the annual AI spending over the next five years is likely to clock a run rate of $560 billion, according to Citigroup’s estimates. Analysts have therefore become more bullish about Nvidia’s potential growth in the coming fiscal years.

NVDA Revenue Estimates for Current Fiscal Year Chart

NVDA Revenue Estimates for Current Fiscal Year data by YCharts

The valuation makes the stock a no-brainer buy

The above chart tells us that Nvidia can keep growing at healthy rates despite having already achieved a high revenue base. Not surprisingly, the company’s bottom-line growth is expected to exceed the broader market’s.

For instance, Nvidia’s projected earnings growth rates of 50% for the current fiscal year and 41% for the next fiscal year are much higher than the S&P 500 index’s expected earnings growth rates of 9% and 14%, respectively. Given that Nvidia is now trading at 30 times forward earnings, investors are getting a good deal on this AI stock. It is available at a slight discount to the tech-heavy Nasdaq-100 index’s earnings multiple of 33.

All this makes Nvidia a smart growth stock to buy with just $200, as this company has the potential to witness a significant jump in its market cap over the next five years that could help multiply that investment substantially.

Harsh Chauhan has no position in any of the stocks mentioned. The Motley Fool has positions in and recommends Advanced Micro Devices, Alphabet, Amazon, Microsoft, Nvidia, and Oracle. The Motley Fool recommends Broadcom and recommends the following options: long January 2026 $395 calls on Microsoft and short January 2026 $405 calls on Microsoft. The Motley Fool has a disclosure policy.

Source link

Warren Buffett Recommends Most Investors Buy This 1 Index Fund — and It Could Turn Just $200 per Month Into $400,000 or More

Buffett believes investors don’t need to do extraordinary things to get great results.

Warren Buffett is well known for being perhaps the greatest stock picker of all time, and for good reasons. Berkshire Hathaway (BRK.A -0.88%) (BRK.B -1.03%), the conglomerate Buffett has led since the mid-1960s, has delivered unbelievable returns for investors over the years, and a big reason is Buffett’s success with using Berkshire’s capital to invest in stocks.

What makes Buffett’s investing style so extraordinary is how simple it is. Buffett invests in great businesses (mostly ‘boring’ ones) that he believes trade for significantly less than their intrinsic value and holds them for as long as they remain great businesses.

He doesn’t chase technology stocks or try to get in on the ground floor of the ‘next big thing.’ He doesn’t trade short-term. And he uses fairly basic investment principles, which he often shares with everyday investors. In addition to being the most successful investor, he is also the most quotable.

Warren Buffett smiling.

Image source: Getty Images.

Buffett’s advice to the average investor

Yes, Warren Buffett has an extraordinary track record when it comes to choosing individual stocks to invest in. But it’s also important to know that he spends many hours (usually over 10 per day) researching and reading.

Of course, you don’t need to spend that much time, but the point is that being a successful individual stock investor requires time and knowledge. As Buffett says, “If you like spending six to eight hours per week working on investments, do it. If you don’t, then dollar-cost average into index funds.”

To be perfectly clear, Buffett doesn’t think there’s anything wrong with this option. In fact, he has directed that his own wife’s inheritance be invested in this way after he’s gone.

Buffett has specifically mentioned the S&P 500 as a great way to bet on American business. And he says that “American business — and consequently a basket of stocks — is virtually certain to be worth far more in the years ahead.”

Buffett is a big fan of this S&P 500 ETF

There are several excellent S&P 500 index funds in the market, but one that Buffett has owned in Berkshire Hathaway‘s portfolio is the Vanguard S&P 500 ETF (VOO -1.28%). This fund simply tracks the 500 stocks in the index, in their respective weights, and should mimic the performance of the benchmark index over time.

Buffett is a big fan of Vanguard, which pioneered the low-cost index fund years ago. The Vanguard S&P 500 ETF has a rock-bottom 0.03% expense ratio, which means that you’ll pay just $0.30 in annual investment fees for every $1,000 in assets. To be clear, this isn’t a fee you physically have to pay — it will just be reflected in the fund’s performance over time. But it’s so low that it will barely have any impact on your long-term results.

You might be surprised at the potential

One final Buffett quote I’ll leave you with is “it isn’t necessary to do extraordinary things to get extraordinary results.” And it certainly applies to index fund investing.

Over the long run, the S&P 500 has produced annualized returns of about 10% over long periods of time. Let’s say that you invest just $200 per month in the Vanguard S&P 500 ETF and that you achieve 10% returns going forward.

  • In 10 years, you’d have about $38,250.
  • In 20 years, you’d have $137,460.
  • In 30 years, you’d have nearly $395,000.
  • In 40 years, you’d have about $1.06 million.

The key is to invest consistently and hold for a long time. The magic of long-term compounding will do the heavy lifting for you. As you can see, if you’re not comfortable with picking individual stocks, it doesn’t necessarily mean that you can’t use the stock market to build extraordinary wealth over time.

Matt Frankel has positions in Berkshire Hathaway and Vanguard S&P 500 ETF. The Motley Fool has positions in and recommends Berkshire Hathaway and Vanguard S&P 500 ETF. The Motley Fool has a disclosure policy.

Source link