A transcript from an employment discrimination lawsuit filed by former JSerra girls’ basketball coach Chyanne Butler indicates the school could be facing a Southern Section investigation for CIF rules violations.
“We are aware of the transcripts and the trial,” Southern Section spokesman Thom Simmons said Friday.
JSerra has “no comment” while the case continues, a school spokesman said.
Butler alleged employment discrimination after being dismissed in January of 2025. A jury trial earlier this year resulted in a hung jury over an allegation of gender discrimination and a new trial is scheduled for Aug. 24 in Orange County Superior Court with Judge David O Carter presiding. Allegations of race discrimination and a sexual harassment claim against an assistant coach were dismissed.
JSerra has not self-reported any CIF violations even though in the first trial, an assistant coach testified under oath about recruiting a player from another school and then providing family expenses including “medical insurance, medical bills, groceries, toiletries, incidentals, basketball shoes.”
That would be a violation of CIF rules.
The Southern Section usually sends allegations of rules violations back to the school to investigate.
Butler is represented by attorney Tim Lawson, who deposed JSerra officials.
The California Supreme Court is poised to rule in a lawsuit that has pitted the state’s court reporters — the workers who create transcripts of court proceedings — against victims of domestic violence and other vulnerable litigants.
The case will determine whether to end a long-standing prohibition on the electronic recording of most civil court proceedings, enabling the use of modern technology to create a “verbatim record,” which is crucial to appeals and other legal challenges.
Advocates say a decision in favor of electronic recording could end a years-long judicial crisis virtually overnight, producing legal records and preserving the right to appeal in tens of thousands of cases in civil, family and probate hearings where court reporters are rarely provided. Participants in the civil proceedings can hire private stenographers to maintain a record of what’s said, but their services can run thousands of dollars a day.
“In many, many courtrooms throughout the state today, there is nobody there, and there’s not going to be anybody there,” attorney Sonya Winner told the high court during oral arguments in Los Angeles last month. “The court reporters the court has on staff are off doing felony trials,” making electronic recording the only alternative for most civil litigants.
Everyone agrees the lack of court reporters is a crisis. Lawyers on both sides have urged the high court to establish a clear right to a verbatim record in civil hearings.
The divergence is over whether the worker shortage is improving slowly or still getting worse, and what the Supreme Court should do about it.
California’s largest public sector union and the court reporters it represents warn the decision could allow the state’s court systems to stop hiring stenographers.
Court reporters say their duty to maintain an accurate record is a profound public trust that can only be performed by a human being, who can intervene to ensure everyone is heard and who bears responsibility if a transcript is missing or incomplete.
Despite California’s sluggish job market, hiring for court reporters remains brisk, bolstered by tens of millions in funding from Sacramento, a recent change in state law and aggressive recruitment by some of the country’s largest court systems, including Los Angeles, Orange and San Diego counties.
Lila Scott, a TV writer, is among those seeking to join the profession. Like a lot of Hollywood talent, she had been struggling to find steady work in recent years.
The “Unicorn Academy” writer was trolling government job sites when she stumbled across a listing for court reporters in Los Angeles — and then another, and another.
“I thought, ‘What the heck is this?’” Scott recalled as she set up for a class at Downey Adult School.
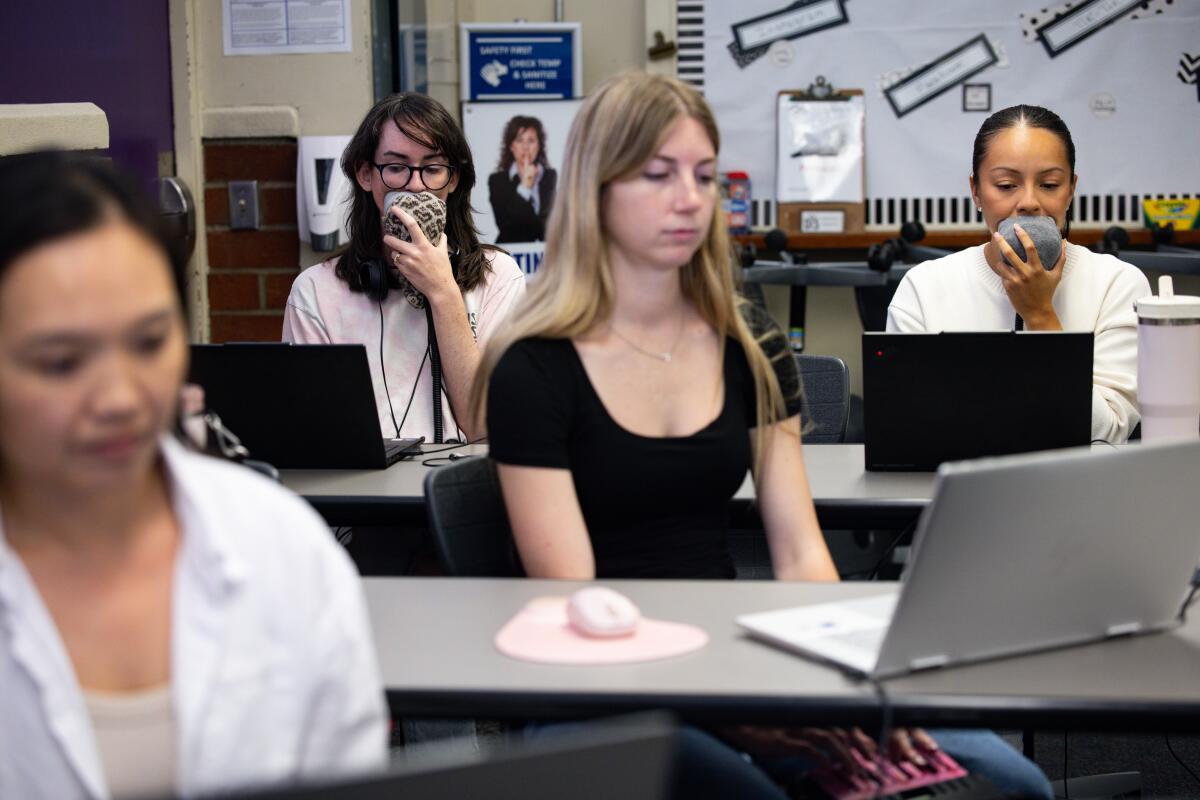
Scott is now in training to become a “voice writer,” a form of note-taking that relies on a device called a stenomask — something like a cross between a podcast mic and a nebulizer — to produce a transcript. Voice writers repeat every word spoken in court along with a sequence of formatting commands to voice recognition software.
“You use your mom voice when you’re dictating,” said another Downey student, 40-year-old Wanda Port. “That stern mom voice, that’s the one you use.”
Traditionally, court reporters have used 22-key steno machines to rapidly take down every word said by lawyers, judges and anyone else who speaks on the record during an official proceeding. The licensing process for these stenographers is significantly longer and more difficult than what voice writers undergo.
A change in state law in 2024 allowed voice writers to become licensed as “certified shorthand reporters,” opening a new pipeline for court staff.
About half of the court reporters hired in California since 2024 have been voice writers, data show.
“Of the 300-plus students we have, it’s about 50/50,” said Jennifer Shenbaum, who directs the Downey program.
The current hiring blitz follows more than a decade of decline, after California’s court systems shed about a third of their reporters amid a protracted budget crisis in 2012. Labor leaders say new licenses have jumped ninefold in recent years, and court reporting classrooms across the state are full.
Diana Van Dyke, a Los Angeles County Superior Court reporter and a shop steward in Service Employees International Union Local 721, credits much of that growth to the expansion of paid internships, signing bonuses and other aggressive recruitment tactics funded by the Legislature and promoted by the union.
Students training to become court reporters practice on stenotypes and stenomasks during a speed-building class at Downey Adult School.
(Kayla Bartkowski / Los Angeles Times)
At Orange County’s Cypress College, which offers court reporter training, job fliers boasting six-figure salaries paper the walls. A pamphlet from the Central District of California that touted “front-page Federal cases” hung in the window of a court reporting classroom, where students practiced typing 200 words per minute.
“By the end of the third test I can’t feel my fingers — but it’s worth it!” said Asia Mendez, a trainee-stenographer.
While advocates for court reporters say humans can still do the job better than machines, the fact that many hearings occur without any official transcript at all has drawn concern from top state officials.
Atty. Gen. Rob Bonta has called the situation “untenable.”
“This is the rare case in which the current application of a statute violates procedural due process,” Bonta’s office said in a brief urging the state’s high court to allow recordings.
Such a ruling would be especially important for survivors of domestic violence, who often find the family court system weaponized against them, said Jennafer Dorfman Wagner, director of programs at the Family Violence Appellate Project, which brought the suit that is now before the California Supreme Court.
“People who want to exert power and control over an ex-partner will find whatever foothold they can and use it,” Wagner said.
Without a record of their proceedings, litigants can’t prove what happened in the courtroom, or appeal if a judge denies a restraining order or approves a custody arrangement that leaves them vulnerable to further violence.
California’s court systems have also thrown their weight behind the plaintiffs in the case.
“California has long led in areas of access to justice and technology, but in this area, it lags far behind the rest of the country, and behind the federal courts that are in this state,” said Mark Yohalem, an attorney representing the state’s superior courts.
The justices, too, seemed eager to embrace electronic recording in cases where no court reporter is available and litigants cannot afford to pay for one on their own, repeatedly pressing lawyers on exactly how such a ruling might be written.
Although the decision would not affect criminal proceedings, the high court judges have expressed concern that court systems may use their ruling to roll back the broader recruitment push as a cost-cutting measure — a worry labor leaders share.
“Electronic recording is cheaper,” said Justice Joshua P. Groban. “It allows any court to just say, for example, that no more court reporters are needed.”
When advocates for the Family Violence Appellate Project told Groban and the other justices hearing the case that such a move by the courts would amount to “bad faith” and should not weigh on their decision, the judge appeared skeptical.
“Either bad faith or fiscal responsibility, depending on the budget that year,” Groban said.
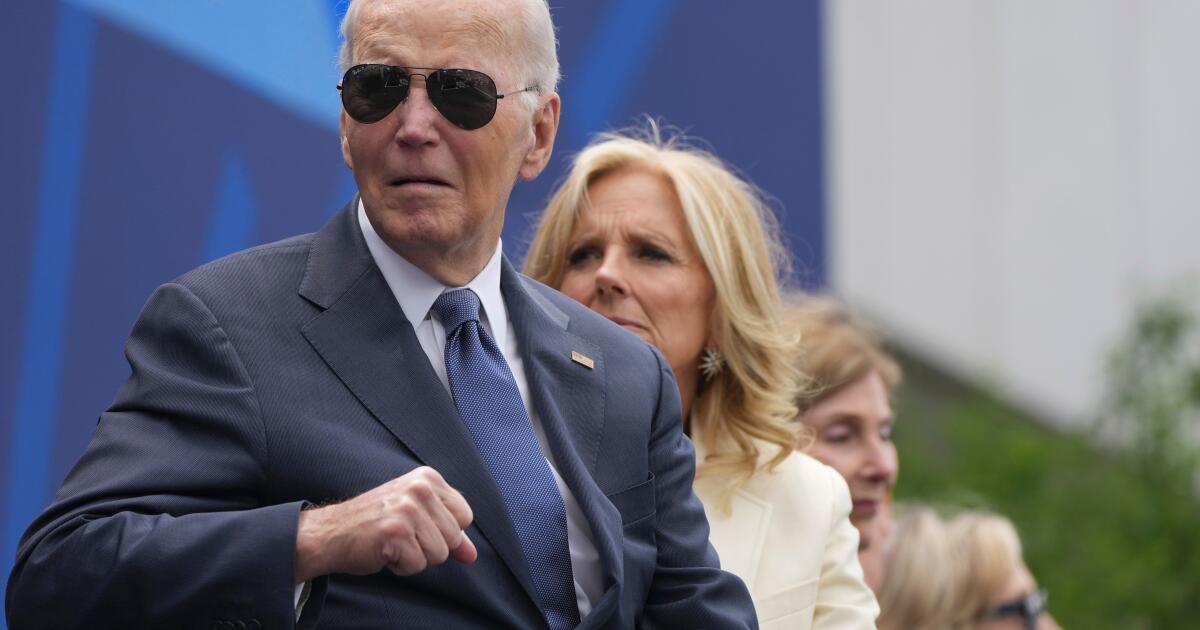
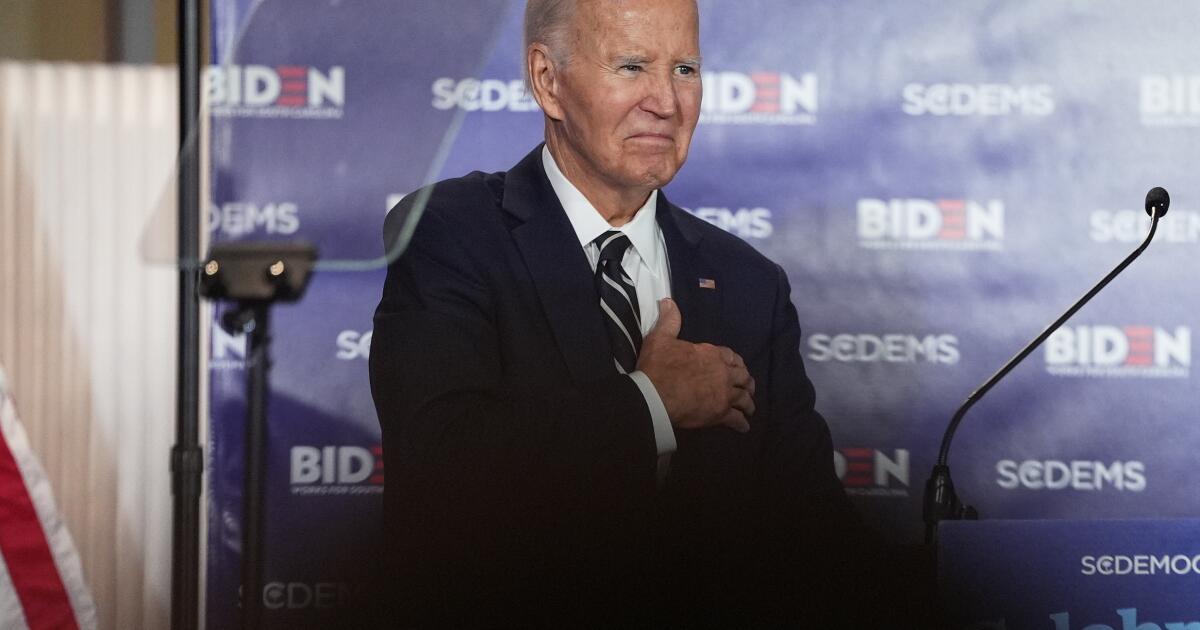
A federal judge on Friday rejected former President Biden’s attempt to block the Trump administration from releasing to a conservative group the recordings that Biden made with a ghostwriter.
U.S. District Judge Dabney Friedrich found that the public interest in the material outweighed whatever privacy rights Biden had.
The recordings were obtained by special counsel Robert Hur in the course of his investigation into whether Biden improperly retained classified documents while a senator and vice president. Republicans in Congress demanded them after Hur declined to file charges against the then-president.
Biden’s Democratic administration refused to turn over the 2017 recordings and transcripts, leading congressional Republicans to hold his attorney general, Merrick Garland, in contempt.
President Trump’s Department of Justice authorized the release of the materials. That led Biden last month to sue to seek to block the release to a staffer at the conservative Heritage Foundation who had formally requested the records.
Biden objected to the release as an invasion of privacy, saying the recordings included him discussing sensitive personal matters such as the death of his older son, Beau Biden. But Friedrich found that the administration redacted that material.
The judge wrote that the materials “contain no mention of highly sensitive topics like illness or death, nor do they mention any non-public persons, including members of Biden’s family.”
Representatives for Biden did not immediately comment but asked Friedrich to bar release of the material while they appeal her decision. The Justice Department did not immediately respond to a request for comment.
Friedrich was nominated by Trump, a Republican, in 2017.
WASHINGTON — Joe Biden sued the Justice Department on Tuesday in an effort to block the release of audio recordings and transcripts of the former president’s interview with a ghostwriter that were obtained by the special counsel who investigated his handling of classified documents.
Biden’s lawyers said in a lawsuit filed in Washington’s federal court that the Justice Department plans to release the files to Congress and a conservative group, the Heritage Foundation, after the department had previously argued that they were exempt from disclosure under the public records law.
Biden’s lawyers argued that the disclosure would “constitute an unwarranted invasion of President Biden’s privacy.”
“Every American, including a sitting or former Vice President, has a right to privacy in the personal conversations he has within his own home,” his attorneys wrote. “And when the U.S. Department of Justice obtains that private information through a criminal investigation, the Department bears a particular responsibility to protect it from disclosure.”
At issue in the case are audio recordings and transcripts of Biden’s interviews at his home in 2016 and 2017 with Mark Zwonitzer, who worked with Biden on his two memoirs. The files were scrutinized by special counsel Robert Hur as part of his investigation into the president’s improper retention of classified documents, from his time as a senator and as vice president.
Hur’s yearlong investigation led to a 345-page report that questioned Biden’s age and mental competence but recommended no criminal charges against the then-81-year-old. Hur said he found insufficient evidence to successfully prosecute a case in court.
Biden has separately fought the release of the audio of his interview with Hur. The House in 2024 voted to hold Biden Atty. Gen. Merrick Garland in contempt of Congress for refusing to turn over that audio after the White House exerted executive privilege, shielding it from Congress.
The transcripts of five hours of Biden interviews with federal prosecutors was released that same year. While Biden was adamant that he treated classified information seriously, the transcript shows that he was at times fuzzy about dates and details and he said he was unfamiliar with the paper trail for some of the sensitive documents he handled.
Republicans have argued Biden was being given a pass by his own Justice Department and that Trump had been unfairly victimized by prosecutors. Democrats, for their part, stressed Biden’s cooperation in the investigation and strongly contrasted that with the separate criminal case against Trump, who was accused of refusing to return classified documents requested by the National Archives that he had at his Florida estate.