March 24 (UPI) — Secretary of Defense Pete Hegseth plans to request $200 billion in funding from Congress as the cost of the United States’ war with Iran grows.
The request comes on top of an already record-setting Pentagon budget passed by Congress last year. Transparency over how funds are being spent continues to dwindle, experts told UPI.
As of March 15, 16 days into the war, it had cost the United States about $12 billion, Kevin Hassett, director of the National Economic Council, said in an interview on Face the Nation.
Linda Bilmes, a Harvard Kennedy School professor and former assistant secretary and chief financial officer of the U.S. Department of Commerce under the Clinton administration, told UPI the reported cost is “just the very tip of the huge iceberg.”
“The $11 billion or whatever it is that they’re quoting is just the immediate operational spend in terms of munitions and fuel and such in the first couple weeks,” Bilmes said. “That doesn’t cover any kind of medium-term expenditures around reset, repair, resupply, replenishment of weapons and systems and munitions and so forth, which is a much bigger number.”
“We’ve probably spent at least $40 billion if you bring into account already everything that has been spent and the fact that it needs to be restocked in the inventory,” Bilmes said.
There are also longer-term costs yet to come, such as the lifetime disability benefits that some 50,000 U.S. troops stationed in the Middle East will be eligible to receive.
“The vast majority of them have been exposed to toxins, contamination from oil fumes, formaldehyde, benzine, all of these things that are in the air,” Bilmes said.
In a 2011 study, Bilmes estimated that the U.S. Department of Veterans Affairs would pay up to $1 trillion in benefits to veterans of the wars in Iraq and Afghanistan in the subsequent 30 to 40 years. In 2021, that estimate increased to $2.5 trillion as the war in Afghanistan continued until August of that year.
During a press briefing last week, Hegseth said the $200 billion request to Congress would be to “ensure that our ammunition is refilled and not just refilled but above and beyond.”
“That’s like the [gross domestic product] of Hungary, the GDP of New Zealand. Medium-sized countries have GDPs the size of just this increase,” Bilmes said. “That’s $1,500 for every household in America.”
The cost of war continues to increase for U.S. taxpayers. The U.S. military is using some advanced weapons technologies, such as AI-powered systems in combat for the first time in the Iran war. Defense contractors are preparing to increase their production of weapons for the United States four times over, President Donald Trump said following a meeting with several earlier this month.
“They have agreed to quadruple production of the ‘Exquisite Class’ weaponry in that we want to reach, as rapidly as possible, the highest levels of quantity,” Trump posted on social media on March 6. “Expansion began three months prior to the meeting and plants and production of many of these weapons are already underway.”
Trump did not clarify which companies were a part of the meeting, nor did he define what “exquisite class weaponry” is.
Bill Hartung, senior research fellow at the Quincy Institute for Responsible Statecraft, told UPI it is becoming increasingly challenging to analyze defense spending as the Pentagon has become less transparent.
Hartung’s research focuses on the arms industry and the U.S. military budget. He is the former director of the Arms and Security Program and the Center for International Policy and co-director of its Sustainable Defense Task Force.
When the United States began sending defense aid to Ukraine in 2022, the government would periodically report what weapons it was sending and the types of training missions it was involved in. That is yet to take place for the war in Iran.
“In this war, really other than a leak, they really haven’t put out much in the way of justification or what exactly is being spent,” Hartung said. “They haven’t put out even a detailed budget this year the way they normally would. Normally an administration that’s been in power a while puts it out in early February. Now, we’re kind of flying blind as to what it’s exactly all going to.”
Transparency has waned from the Pentagon over the course of years. Funding put toward defense in last year’s budget reconciliation was marked in broad categories, rather than a more detailed, itemized budget.
Hartung said it was not the “normal budget process” and that hearings over the Pentagon’s budget lacked the same level of substance and oversight of years passed.
In July, the Office of the Under Secretary of Defense published its budget request for program acquisitions for the 2026 fiscal year. It requested $179.1 billion dedicated to research, development, test and evaluation of major weapon systems, $205.2 billion for procurement and $961.7 billion for total Department of Defense research and procurement. This accounts for about 40% of the department’s total funding.
The reconciliation bill passed by Congress added $150 billion in new defense spending, increasing the department’s total budget to more than $1 trillion.
Among the biggest expenditures approved by Congress were more than $25 billion for munitions and supply chain resiliency, $24 billion for integrated air and missile defense, $29 billion for shipbuilding, and $14 billion for enhancing resources for nuclear forces.
About $10 million was approved for department oversight.
The longer the war continues, the greater the cost will be to the United States. Then comes the matter of reconstruction.
The United States has historically been involved in reconstruction efforts following wars it was engaged in, including World War II and the Iraq and Afghanistan wars.
The U.S. government spent about $141 billion on reconstruction in Afghanistan between 2002 and 2021, the U.S. Government Accountability Office reported.
The war with Iran has spread beyond its borders already. As of Monday, Fatih Birol, head of the International Energy Agency, said that at least 40 energy sites have been damaged in the war, including sites belonging to U.S. allies.
Whether and to what extent the United States would be involved in reconstruction efforts in Iran and among affected allies is another variable that will not be known until the fighting stops.
Beyond the budget implications is the human cost of war. Hartung said, depending on the decision to put U.S. troops on the ground in Iran, the toll paid by service members could be larger yet. At least 13 U.S. troops have already been killed in action.
The Iran Health Ministry reported earlier this month that more than 1,200 civilians have been killed. Among them are at least 165 people killed in a strike on an elementary school for girls in Minab, Iraq. Many of the victims in the school bombing were children.
A preliminary investigation by the U.S. military has found that the United States is likely responsible for the deadly strike on the school by a Tomahawk missile on Feb. 28. The United States is the only country involved in the war that uses Tomahawk missiles.
The cost of the operation that killed the victims at the elementary school likely exceeds $1 million. A Tomahawk missile costs about $2 million.
“It could have been a million or two to hit that one target,” Hartung said. “They do have a small drone-like system they’ve been using that’s like $35,000 each but I don’t know exactly what they used. A cruise missile’s $2 million but then some of the other bombs could be a few hundred thousand but it’s remarkable how much even one strike can cost. Some of the planes are thousands or tens of thousands an hour.”
Unlike the Vietnam and Korean War and those that preceded them, the United States does not pay for its modern war efforts by raising taxes. Instead, it incurs an ever-growing debt that now accounts for about 17% of the government’s budget in fiscal year 2026.
Bilmes is writing about the changing approach to funding war in her upcoming book The Ghost Budget: Paying for America’s Wars. It is due to be released in the fall.
“We’ve borrowed every penny that has been spent right now. We’re just adding to the debt,” Bilmes said.
As the United States takes on more debt to fund a growing defense budget, it has also cut taxes, reducing revenues.
“Arguably, our approach to this, in engaging in another war of choice, is positioning us closer to another major economic crisis,” Bilmes said.
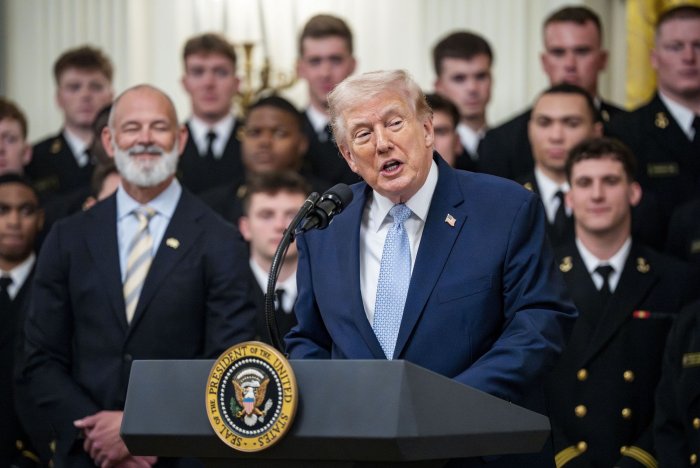
President Donald Trump presents the Commander in Chief’s Trophy to the Navy Midshipmen football team during a ceremony in the East Room of the White House on Friday. The award is presented annually to the winner of the football competition between the Navy, Air Force and Army. Navy has won the trophy back to back years and 13 times over the last 23 years. Photo by Bonnie Cash/UPI |
License Photo