ETF

The Smartest Index ETF to Buy With $1,000 Right Now

You can make a strong argument that buying the S&P 500 index is a good choice today, but maybe you should consider some value stocks, too.

The S&P 500 index (SNPINDEX: ^GSPC) is trading near all-time highs. Since the Vanguard S&P 500 Index ETF (VOO 0.60%) tracks the S&P 500, it is also trading near all-time highs. And it could still be a smart move to buy the index via an investment in the exchange-traded fund.

But there might be a smarter choice, if you take valuations into consideration. Which is where another Vanguard exchange-traded fund (ETF) comes into play. Here’s what you need to know.

Just get started

One of the biggest things any investor can do is get started. So if you have $1,000 to invest and you’ve never done so before, it could be a very good idea to just buy the market. By default, that would be the S&P 500 index for most investors. And then you should just keep buying the market every single month to benefit from dollar-cost averaging.

A line of caution police tape.

Image source: Getty Images.

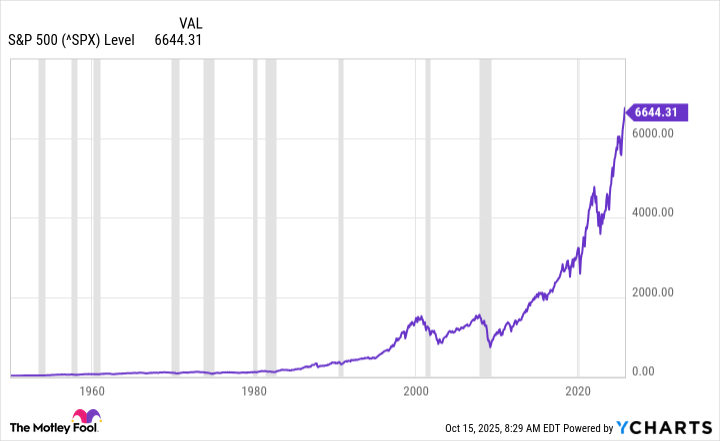
Since all of the products that track the same index basically do the same thing, the Vanguard S&P 500 ETF is going to be a top choice. With an expense ratio of just 0.03%, it is one of the cheapest ways to gain exposure to the S&P. Why pay more for the same basic service? As the chart below shows, the market has recovered from even the worst bear markets and then moved on to reach even higher highs.

^SPX Chart

^SPX data by YCharts.

If you have $1,000 or $10,000 (or even more) to invest, just getting started is going to be the smartest move. Then, keep going and never look back.

Sure, in the near term, you might suffer through some paper losses. But over the long term, history suggests you’ll still make out just fine. If buying when things are expensive is just too much for you, however, you might find that the Vanguard Value ETF (VTV 0.51%) is an even smarter choice.

Why go the value route?

A $1,000 investment in the Vanguard Value ETF will buy you around five shares of the exchange-traded fund. What you will end up owning is a portfolio of large U.S. companies that have valuations that are low relative to the broader market. With the S&P 500 near all-time highs, that’s not an insignificant issue.

Putting some numbers on this might help. The Vanguard Growth ETF (VUG 0.56%), the opposite extreme from the value ETF, has an average price-to-earnings ratio of around 40. That’s pretty expensive, but you would expect that, given its focus on growth.

The Vanguard S&P 500 Index ETF has an average P/E of about 29. Still pretty high, thanks to the fact that some very large technology stocks (which tend to be growth-focused) are driving its performance. The Vanguard Value ETF’s average P/E is a little under 21. It wouldn’t be fair to call 21 cheap, but it is most certainly cheaper than both the S&P 500 and Vanguard Growth ETF.

The same trend exists with the price-to-book-value ratio (P/B). The Vanguard Growth ETF comes in with a P/B ratio of 12.5, the Vanguard S&P 500 Index ETF sits at 5.2, and the Vanguard Value ETF is the lowest on the valuation metric at just 2.8. While it won’t necessarily save you from a bear market, focusing on value stocks when growth is in favor could soften the pain of a deep downturn.

Get started first, but consider a value component when you do

To reiterate the theme here, the most important investment decision you can make is to start investing in the first place. The second one is to keep it up even when times get tough on Wall Street. But if you have already made those choices, then maybe it makes sense to consider taking a more nuanced approach with what you choose to buy.

If all you have is $1,000 to start, perhaps consider splitting it between the S&P 500 Index ETF and the Value ETF, to lean you toward cheaper stocks. If you already have a portfolio, then the smartest move could be to put a grand into just the Value ETF to help diversify you away from the growth stocks that are leading the market into the nosebleed seats.

Reuben Gregg Brewer has no position in any of the stocks mentioned. The Motley Fool has positions in and recommends Vanguard Index Funds-Vanguard Growth ETF, Vanguard Index Funds-Vanguard Value ETF, and Vanguard S&P 500 ETF. The Motley Fool has a disclosure policy.

Source link

Want Decades of Passive Income? Buy This ETF and Hold It Forever.

Contrary to a common assumption, not every investment forces you to make a major either/or trade-off. You can have (most of) the best of both worlds.

If you’re looking for a low-maintenance income-generating investment that you can buy and hold indefinitely, an exchange-traded fund (ETF) is an obvious choice. And you’ve certainly got plenty of options.

Not all dividend ETFs are the same, though. There are better options than others. In fact, if you’re looking for a great all-around dividend-paying exchange-traded fund to buy and hold forever, one stands out above them all.

And it’s probably not the one you think it is.

More to the matter than mere yield

If you’ve done any amount of digging into dividend ETFs as a category, then you likely already know that the Schwab U.S. Dividend Equity ETF (SCHD 0.79%) currently boasts a trailing yield of 3.9%. That’s huge for a fund of this size and ilk (quality blue chip stocks), even topping the 2.5% yield you can get from the Vanguard High Dividend Yield ETF (VYM 0.44%) at this time.

Older woman sitting at a desk in front of a laptop.

Image source: Getty Images.

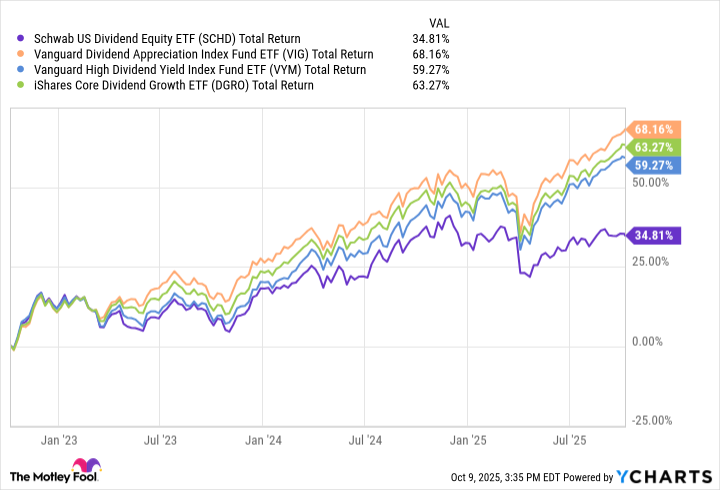
There’s more to the matter than merely plugging into a fund when its yield hits a particular number, however. Is the current dividend sustainable? Does it have a history of growing its payouts enough to keep up with inflation? Is the ETF also producing enough capital appreciation? When you start asking these questions, the Schwab U.S. Dividend Equity fund doesn’t exactly shine. It has underperformed the S&P 500 (^GSPC 0.53%) as well as most of the other major dividend funds since 2023, for instance, mostly because the Dow Jones U.S. Dividend 100 index that it mirrors doesn’t hold many — if any — of the tech stocks that have been lifted by the artificial intelligence megatrend.

That’s not inherently a bad thing, mind you. There may well come a time when these technology stocks struggle more than most while demand reignites for the components of the Dow Jones U.S. Dividend 100. Nevertheless, even factoring in its above-average dividend, the Schwab U.S. Dividend Equity ETF’s lingering subpar overall performance has made it tough to own for a while now. There’s also no obvious reason to think that relative weakness will soon end.

The best all-around choice

So which fund is the ideal all-around buy-and-hold “forever” dividend ETF? For many income-minded investors, it’s going to be the iShares Core Dividend Growth ETF (DGRO 0.53%).

It’s not a particularly popular fund. It has less than $35 billion in its asset pool, for perspective, versus more than $100 billion for the massive Vanguard Dividend Appreciation ETF (VIG 0.27%). Schwab’s U.S. Dividend Equity ETF is more sizable as well, with about $70 billion under management. You can also find yields better than DGRO’s current trailing yield of just under 2.2%.

Don’t let its smallish size and average yield fool you, though. The iShares Core Dividend Growth ETF packs enough punch where it counts the most. And it’s capable of packing this punch indefinitely.

This fund tracks the Morningstar US Dividend Growth Index. Like all of Morningstar‘s dividend growth indexes, this one only includes companies that have a track record of at least five straight years of annual payout hikes. It also excludes the highest-yielding 10% of stocks based on the premise that an unusually high yield can be a warning that trouble’s brewing for a business. In this vein, the index also excludes stocks of companies that pay out more than 75% of their earnings in the form of dividends.

Where the Morningstar US Dividend Growth Index really differentiates itself, however, is in the size of each position it holds. Although no holding is allowed to make up more than 3% of its total portfolio, its positions are weighted in proportion to the value of the stocks’ dividend payments. End result? This ETF’s biggest positions right now are Johnson & Johnson, Apple, JPMorgan Chase, Microsoft, and ExxonMobil. That’s an incredibly diverse group of stocks, although the fund’s other 392 holdings aren’t any less diverse.

Sure, many of these holdings don’t exactly boast massive dividend yields. Plenty of them do have impressive yields, though, and the ones that don’t are supplying value via price appreciation. It’s the balanced weighting of these different kinds of stocks that makes this ETF such a reliable overall performer.

The irony? Despite holding many low-yielding tickers of companies that don’t exactly prioritize their dividend payments, this fund’s quarterly per-share payment has nearly tripled over the course of the past decade. You’d be hard-pressed to find better from an ETF that also produces this kind of capital appreciation.

No compromise needed

None of this is to suggest that it would be a mistake to own any other income-focused exchange-traded fund. There are perfectly valid reasons for investing in something like the Schwab U.S. Dividend Equity ETF at this time, for instance, such as an immediate need for an above-average yield. It’s also not wrong to own more than one kind of dividend ETF, diversifying your investment income streams.

If you just want a super-simple dividend income option that you can buy and hold forever, though, the iShares Core Dividend Growth ETF is a fantastic but often overlooked choice. Unlike too many other investment options, with DGRO, you don’t have to sacrifice too much growth in exchange for reliable dividend income, or vice versa. It’s a balance of (nearly) the best of both worlds.

The only thing you can’t really get from the iShares Core Dividend Growth fund is a hefty starting dividend yield, but most long-term investors will consider that a fair trade-off.

JPMorgan Chase is an advertising partner of Motley Fool Money. James Brumley has no position in any of the stocks mentioned. The Motley Fool has positions in and recommends Apple, JPMorgan Chase, Microsoft, Vanguard Dividend Appreciation ETF, and Vanguard Whitehall Funds-Vanguard High Dividend Yield ETF. The Motley Fool recommends Johnson & Johnson and recommends the following options: long January 2026 $395 calls on Microsoft and short January 2026 $405 calls on Microsoft. The Motley Fool has a disclosure policy.

Source link

1 Unstoppable Vanguard ETF to Buy With $630 During the S&P 500 Sell-Off

This broad-market index gives investors a taste of everything — even more than the S&P 500.

Even Warren Buffett, the greatest stock picker of all time, endorses low-cost, broad-market index funds and exchange-traded funds for most retail investors. This is because most investors don’t have the time to deeply research individual stocks, while broader-market indexes tend to win over time, with 8% to 10% long-term returns on average.

While large banks were the first to create index funds for their institutional clients, Vanguard was the first to offer diversified index funds to the public in 1976. Today, Vanguard is one of just a few major asset managers offering accessible, extremely low-cost index funds, costing investors just a handful of basis points in fees.

After the market’s strong recovery from April’s “Liberation Day” tariff fiasco, here’s the Vanguard fund I’d recommend today.

Buy the total market

Today, technology stocks, particularly around the AI buildout, have soared to very high valuations. Interestingly, some of the largest stocks in the world that have gone up the most, defying the law of large numbers, leaving large indexes like the Nasdaq-100 or even S&P 500 (^GSPC 0.53%) the most concentrated they’ve ever been in recent history.

Of course, there is a good reason why growth-oriented, large-cap technology stocks have soared over the past six months and even the last few years: artificial intelligence. The prospect of generative AI could very well lead to the next industrial revolution; meanwhile, only the largest, best-funded, most technically advanced companies likely have a chance to compete. Therefore, it’s no surprise the “Magnificent Seven” stocks only seem to be getting stronger.

That being said, valuation matters, and the widening gulf between the largest tech stocks and smaller stocks in other sectors is huge. Furthermore, once AI technology is honed and widely distributed, every business in every sector of the economy should be able to benefit from GenAI.

So while investors shouldn’t abandon AI tech stocks en masse, now would also be a good time to look at other types of stock in left-behind sectors. That makes this Vanguard ETF an excellent choice today.

Person smiling at his computer desktop.

Image source: Getty Images.

Vanguard Total Stock Market Index Fund

The Vanguard Total Stock Market Index Fund (VTI 0.51%) is my recommendation for index investors looking to put money to work today. As the name implies, this index tracks the entire stock market, including large-, mid-, small-, and even micro-cap stocks — the entire investing universe in the U.S.

Of course, a broad-market index will also have high weightings of the large-cap tech stocks discussed. Yet while investing in the total market index fund will still give investors some exposure to the AI revolution, those stocks will have a smaller weight than other index funds, such as the Vanguard S&P 500 ETF (VOO 0.60%). For instance, in the VTI, the largest stock in the market, Nvidia, has a 6.5% weighting, whereas Nvidia sports a 7.8% weighting in the VOO, which tracks the S&P 500, and a 9.9% weighting in the Invesco QQQ Trust (QQQ 0.73%), which tracks the Nasdaq-100.

Meanwhile, the total market fund will give a larger weight to smaller stocks in other cheaper sectors of the economy, which may outperform if there is a rebalancing and reversion to the mean. This is what happened in the early 2000s, when technology stocks crashed over the course of three years, but cheaper value stocks in other sectors of the market went on to outperform.

Currently, the VTI trades at a weighted average 27.2 times earnings, with a 1.14% dividend yield. It has risen 13.9% year to date, which is a strong performance, albeit behind that of the VOO and QQQ. Its expense ratio is 0.03%, which is so minuscule the fund is practically free.

Torn between momentum and value? Buy everything

The VTI is therefore a nice middle ground between those who are enthusiastic about the general prospects for AI technology, but are squeamish about tech stocks’ sky-high valuations relative to lower-priced sectors today. Therefore, it’s a great choice for investors looking to allocate money to stocks in October as part of their investment plan.

Billy Duberstein and/or his clients have no position in any of the stocks mentioned. The Motley Fool has positions in and recommends Nvidia, Vanguard S&P 500 ETF, and Vanguard Total Stock Market ETF. The Motley Fool has a disclosure policy.

Source link

Want Reliable Passive Income? 1 ETF to Buy Right Now

Safer, income-producing stocks are suddenly looking attractive.

Stock prices continue to grow to the sky, and the S&P 500 index has set 28 record highs this year through the end of September.

Moreover, valuations continue to stretch. At 39.7, the Shiller Cyclically Adjusted (CAPE) Ratio is at its second highest level of the past century (higher than the eve of the Great Crash of 1929, though still a bit lower than the eve of the Internet bubble burst in 1999).

What should a prudent investor do in such a frothy market?

Investing in defensive stocks that are less vulnerable to market pullbacks, drawdowns, and corrections is one great idea. And here’s an even better idea: Buying reliable, stable defensive stocks that pay high dividends and reward investors with passive income.

Stability and income

So, what’s the best exchange-traded fund (ETF) to buy right now if you want exposure to defensive stocks that provide stable earnings and dividends? I like the Vanguard High Dividend Yield ETF (VYM) because it gives you a stake in a broad swath of high-yielding, stable, large-cap value stocks. Thus, you get safety and reliable passive income, and at a rock-bottom price.

The Vanguard High Dividend Yield ETF tracks the performance of the FTSE High Dividend Yield Index, which measures the return of a set of stocks characterized by high dividend yields. With total assets of $81.3 billion, the fund currently holds 579 stocks. Its top five holdings are:

  • Broadcom, which accounts for 6.7% of the fund
  • JPMorgan Chase, 4.1%
  • ExxonMobil, 2.4%
  • Johnson & Johnson, 2.1%
  • Walmart, 2.1%

Such big, safe companies — ones that we would expect to be around for the long haul — are typical of the fund’s holdings. And it avoids risky and distressed firms.

Other than chipmaker Broadcom, no one stock currently accounts for more than 5% of the ETF, which makes it highly diversified. It’s also diversified among sectors. Its biggest holding by sector is financials, with about 22% of its assets in that industry. It also has large positions in consumer discretionary, healthcare, industrials, and technology, among a few other sectors.

The fund’s current yield is a very respectable 2.49%, about 1.3 percentage points above that of the S&P 500. The annual fee is a minuscule 0.06%, which is far lower than the 0.87% average for similar funds. The ETF is up about 10.4% year to date, which is solid given the income it produces.

Not so boring

Investors who think dividends are boring should think again. From 1940 to 2024, dividend income contributed 34% of the total return of the S&P 500, according to Hartford Funds.

A picture of a bull pushing coins up a stock market roller coaster.

Source: Getty Images.

That contribution varies a lot by decade. Dividends contribute a larger share of the total market return when the stock market is rising slowly, and a smaller share when it’s soaring. That makes sense. Companies with higher-yielding stocks tend to be large and slower-growing, just what you want to own in a challenging market environment.

Yes, there are stocks with much higher yields than those in the Vanguard High Dividend Yield ETF. But that’s by design, too. The fund avoids stocks with deteriorating fundamentals and declining prices, limiting its exposure to risky companies.

Best of all — considering the bubbly nature of the current stock market — this dividend ETF outperforms in difficult markets. It beat similar funds during the COVID-19 sell-off of early 2020 and outperformed other funds in its category by 7 percentage points in 2022, when the S&P 500 fell more than 19%.

The Vanguard High Dividend Yield ETF provides a steady, safer approach to higher-yielding stocks, and reliable passive income. Such an approach is beginning to look very attractive to many investors.

JPMorgan Chase is an advertising partner of Motley Fool Money. Matthew Benjamin has no position in any of the stocks mentioned. The Motley Fool has positions in and recommends JPMorgan Chase, Vanguard Whitehall Funds-Vanguard High Dividend Yield ETF, and Walmart. The Motley Fool recommends Broadcom and Johnson & Johnson. The Motley Fool has a disclosure policy.

Source link

Oriental Harbor Trims $5.4 Million From TQQQ ETF — But Still Keeps Big Tech Bet Intact

On Tuesday, Oriental Harbor Investment Master Fund disclosed selling 59,274 shares of ProShares UltraPro QQQ (TQQQ -1.88%) in an estimated $5.4 million trade, according to a recent SEC filing.

What Happened

According to a filing with the Securities and Exchange Commission, Oriental Harbor Investment Master Fund sold 59,274 shares of ProShares UltraPro QQQ during the quarter. The estimated transaction value was $5.4 million. The fund’s TQQQ position now stands at about 1.2 million shares, valued at $124.2 million.

What Else to Know

Following the sale, TQQQ represents 9.6% of the fund’s reportable assets under management.

Top holdings after the filing:

  • NASDAQ:NVDA: $236.2 million (18.3% of AUM)
  • NASDAQ:GOOGL: $224.1 million (17.4% of AUM)
  • NYSEMKT:FNGU: $144.6 million (11.2% of AUM)
  • NASDAQ:TQQQ: $124.2 million (9.6% of AUM)
  • NASDAQ:META: $99.5 million (7.7% of AUM)

As of Tuesday’s market close, shares of TQQQ were priced at $101.13, up 33% over the past year, outperforming the S&P 500 by 20 percentage points.

ETF Overview

Metric Value
AUM N/A
Price (as of market close on Tuesday) $101.13
One-year total return 44%
Dividend yield 0.65%

Company Snapshot

  • TQQQ’s investment strategy seeks to deliver daily performance consistent with the fund’s objective through the use of financial instruments.
  • Underlying holdings are composed of the 100 largest non-financial companies listed on the Nasdaq Stock Market.
  • The fund structure is non-diversified.

ProShares UltraPro QQQ is an ETF that seeks daily returns consistent with its investment objective by tracking the Nasdaq-100 Index. By employing financial instruments, the fund aims to achieve its daily return objective.

Foolish Take

Hong Kong–based Oriental Harbor Investment Master Fund pared back its position in ProShares UltraPro QQQ last quarter, selling roughly $5.4 million worth of shares. Despite the reduction, TQQQ remains a core holding, accounting for nearly 10% of the fund’s reported assets. The ETF continues to rank just behind Nvidia, Alphabet, and FNGU, reflecting the fund’s deep concentration in leveraged and technology-driven strategies.

TQQQ, which seeks three times the daily performance of the Nasdaq-100 Index, has soared 33% in the past year, outpacing the S&P 500 by about 20 percentage points. Its top underlying exposures—Nvidia, Microsoft, Apple, and Amazon—mirror Oriental Harbor’s own equity bets, creating both alignment and amplification across the portfolio.

While leveraged ETFs like TQQQ can magnify gains, they also heighten risk when markets turn volatile. For Oriental Harbor, trimming the position may be a prudent rebalancing move after strong returns, especially given its already substantial exposure to the same megacap tech names through direct holdings and other leveraged funds like FNGU. The strategy suggests discipline, not retreat, as the fund locks in profits while maintaining a high-conviction tilt toward tech-fueled growth.

Glossary

ETF: Exchange-traded fund; a pooled investment fund traded on stock exchanges, similar to stocks.

UltraPro: Indicates an ETF aiming for leveraged returns, typically providing a multiple of the daily performance of an index.

Assets under management (AUM): The total market value of assets a fund manages on behalf of investors.

Non-diversified: A fund that invests a large portion of assets in a small number of holdings, increasing concentration risk.

Leveraged ETF: An ETF using financial instruments to amplify returns, often targeting a multiple of an index’s daily performance.

Dividend yield: Annual dividends paid by an investment, expressed as a percentage of its current price.

Underlying holdings: The individual securities or assets that make up a fund’s portfolio.

Nasdaq-100 Index: An index of the 100 largest non-financial companies listed on the Nasdaq Stock Market.

Daily return objective: The fund’s goal to match or multiply the performance of its benchmark index each trading day.

Financial instruments: Contracts such as derivatives or swaps used to achieve specific investment outcomes.

Outperforming: Achieving a higher return than a specific benchmark or index over a given period.

Reportable assets: Assets that must be disclosed in regulatory filings, such as those reported to the SEC.

Jonathan Ponciano has no position in any of the stocks mentioned. The Motley Fool has positions in and recommends Alphabet, Meta Platforms, and Nvidia. The Motley Fool has a disclosure policy.

Source link

Is the Schwab US Dividend Equity ETF a Buy Now?

This exchange-traded fund’s persistent underperformance may be on the verge of reversing course.

Are all dividend funds the same? They often are, even if each one is structurally and strategically unique. There’s only so much difference possible when a company and its stock’s primary purpose is just generating cash flow.

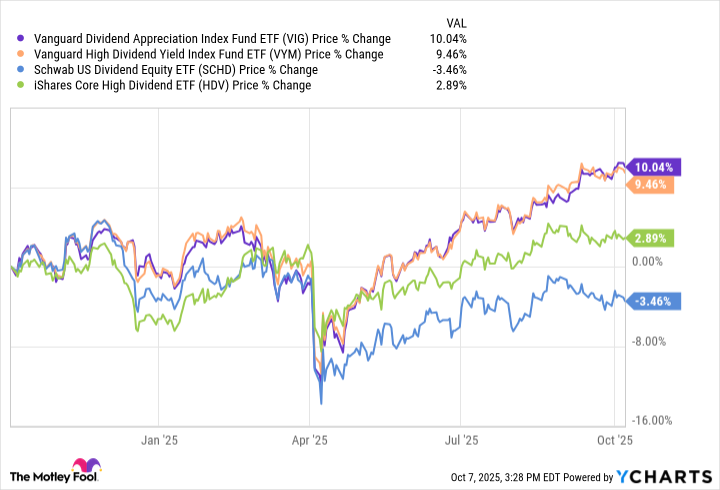
And yet, owners of the Schwab U.S. Dividend Equity ETF (SCHD -1.70%) know all too well that dividend-oriented exchange-traded funds can at times be considerably different than one another. Their fund has measurably underperformed other dividend ETFs like the Vanguard Dividend Appreciation ETF, the iShares Core Dividend Growth ETF, and Vanguard High Dividend Yield ETF over the course of the past three years. Indeed, the disparity’s been wide enough to leave them wondering if they made a mistake that should be corrected as soon as possible.

Well, they didn’t make the wrong choice, so there’s no correction to be made. The very reason this dividend ETF has underperformed of late, in fact, is the very same reason income-seeking investors might want to buy the Schwab U.S. Dividend Equity ETF now.

The same, but different — and more different than the same

What’s Schwab’s U.S. Dividend Equity ETF? It’s meant to mirror the performance of the Dow Jones U.S. Dividend Index, which, just as the name suggests, is dividend-focused. So is the Morningstar US Dividend Growth Index that serves as the basis for iShares’ Core Dividend Growth ETF, though, along with the Vanguard Dividend Appreciation ETF’s underlying S&P U.S. Dividend Growers Index, for that matter.

They’re not all the same, though. And it matters.

Take a comparison of the S&P U.S. Dividend Growers Index behind Vanguard’s Dividend Appreciation fund to the iShares Core Dividend Growth ETF’s Morningstar US Dividend Growth Index as an example. The former consists of U.S.-listed companies that have raised their dividend payments for at least the past 10 years, but it excludes the very highest-yielding tickers (on concerns that the high yields are unsustainable). The latter only requires five years of uninterrupted dividend growth, although it also generally excludes stocks with suspiciously high yields.

End result? The Vanguard fund’s top three holdings right now are Broadcom, Microsoft, and JPMorgan Chase, while the iShares ETF’s biggest three positions at this time are Apple, Microsoft, and Johnson & Johnson. They’re more different than alike, even if there is some overlap.

Middle-aged man reviewing paperwork while seated in front of a laptop.

Image source: Getty Images.

The Vanguard High Dividend Yield ETF’s underlying FTSE High Dividend Yield Index, by the way, currently holds Broadcom, JPMorgan, and Exxon-Mobil as its top three positions — three names that offer the high yield that the index prioritizes. Even so, the fund’s trailing yield is a modest 2.45% at this time, versus the iShares ETF’s yield of 2.2% and the trailing dividend yield of 1.6% currently offered by the Vanguard Dividend Appreciation fund.

Where does Schwab’s U.S. Dividend Equity ETF stand? The Dow Jones U.S. Dividend Index’s biggest three positions right now are AbbVie, Lockheed Martin, and Cisco Systems, followed closely by Merck and ConocoPhillips. In fact, you won’t start seeing any serious overlap between this fund and the other three dividend ETFs in focus here until those positions are so small that they don’t really matter.

That’s why this ETF has underperformed the other three funds in question since early 2023; it’s not holding many of the market’s most popular growth names right now. Indeed, it currently holds a bunch of the market’s least popular value stocks.

SCHD Total Return Level Chart

SCHD Total Return Level data by YCharts

But that’s exactly why income-minded investors might want to dive into the Schwab ETF at this time, particularly in light of its sizable trailing dividend yield of right around 3.7%.

What went wrong for dividend-paying value names?

In retrospect, the fund’s recent underperformance actually makes a lot of sense. The few technology stocks that pay any dividend at all have performed exceedingly well since the launch of OpenAI’s ChatGPT in November 2022, setting off an artificial intelligence arms race that sent a bunch of these stocks sharply higher. The dynamic was also bullish for financial stocks like JPMorgan, which helps companies raise funds or make the acquisitions they need to take full advantage of the AI revolution.

At the other end of the spectrum, most of the Schwab U.S. Dividend Equity ETF’s holdings have been on the wrong side of one force or another. Regulatory headwinds and the impending expiration of key patents have proven problematic for pharmaceutical outfits AbbVie and Merck, for instance.

Inflation and the subsequent rise in interest rates are another one of these forces, and arguably the biggest. Although both have historically been more of a challenge for growth stocks than value names, in this instance, the opposite has been (mostly) true.

Just bear in mind how incredibly unusual the past three years have been. The bulk of growth stocks’ leadership has been fueled by the aforementioned advent of artificial intelligence, creating a secular growth opportunity that wouldn’t be stymied by any economic backdrop.

Also know that the so-called “Magnificent Seven” stocks have done the vast majority of the market’s recent heavy lifting, so to speak, fueled by AI. Data from Yardeni Research suggests that without the help of these seven tech-centric tickers, the S&P 500‘s would be about one-third less than what it’s actually been since early 2023.

It would also be naïve to pretend that value stocks like Merck, Cisco, and ConocoPhillips just haven’t offered the excitement that most investors have craved in the post-pandemic, AI-centered environment.

Here comes the pendulum

As is always the case, though, the cyclical pendulum will eventually swing back the other way. And that’s likely to happen sooner or later. As number-crunching done by Morningstar analyst David Sekera recently prompted him to note, “By style, value remains undervalued, trading at a 3% discount, whereas core stocks are at a 4% premium and growth stocks are at a 12% premium.” He adds, “Since 2010, the growth category has traded at a higher premium only 5% of the time.”

This dynamic, of course, works against dividend ETFs’ growth names, and works for dividend ETFs like the Schwab U.S. Dividend Equity ETF, which almost exclusively holds value stocks. The market just needs a catalyst to start such a shift.

That may be in the offing, though. JPMorgan CEO Jamie Dimon recently lamented in an interview with the BBC, “I am far more worried about that [a market correction] than others… I would give it a higher probability than I think is probably priced in the market and by others.” And this worry follows Federal Reserve Chairman Jerome Powell’s recent comment that U.S. stocks are “fairly highly valued.” That’s a screaming red flag from someone who makes a point of maintaining composure and not inciting panic.

Sure, such a setback could undermine the Schwab U.S. Dividend Equity ETF as much as it does any other stock or fund. That’s not the chief concern of any correction, though. It’s what happens afterward. That bearish jolt may well inspire investors to rethink everything about the risks they’ve been taking, souring them on tech names and turning them onto value names that also dish out above-average income.

You’ll just want to be positioned before it all starts to happen.

Source link

Why the Vanguard High Dividend Yield ETF (VYM) Could Be the ETF to Own in 2025

If you’re looking for relative safety, consistency, and passive income, this ETF can offer all three.

Exchange-traded funds (ETFs) are one of the best investments for those looking for lower-effort ways to get involved in the stock market, and the right investment can help you build long-term wealth while barely lifting a finger.

But with some investors worried about potential volatility, it can be tough to choose the right ETF. While there’s no single best investment for every portfolio, there are a few good reasons why the Vanguard High Dividend Yield ETF (VYM -2.00%) could be a great buy in 2025.

Stacks of coins increasing in size with plants growing out of them.

Image source: Getty Images.

1. Its diversification can help limit risk

The Vanguard High Dividend Yield ETF contains 579 stocks, which are fairly evenly allocated across 10 different industries. It’s most heavily allocated to the financials sector, representing close to 22% of the fund.

This level of diversification can help mitigate risk. In general, the more stocks you own across a wider variety of industries, the safer your portfolio will be. There are limits to diversification, but if you’re investing in hundreds of stocks across 10 industries, your portfolio won’t be crushed if a handful of stocks or even an entire sector is hit hard in a market downturn.

One thing that makes this fund somewhat different from many other ETFs is its lighter allocation toward tech stocks at only 12% of the fund — compared to, for example, the Vanguard S&P 500 ETF, which devotes over 33% of the fund toward tech.

Tech stocks often deliver higher returns than those from other sectors, but they can also be highly volatile. Relying less on this industry can help reduce risk and short-term turbulence, which can be a major advantage in periods of uncertainty.

2. It offers consistent performance

This ETF won’t experience the same returns as, say, a high-powered growth ETF, and that’s OK. Each fund has its own unique strengths and weaknesses, and the High Dividend Yield ETF’s biggest strength is consistency.

All the stocks in this fund have a history of delivering high dividend yields year after year. Companies with strong dividend payouts are often more mature and established than their younger and more volatile counterparts, as the latter are generally more focused on growing and stabilizing the business than paying out dividends.

This doesn’t mean that these companies won’t face shakiness in the near term, especially during a market downturn. But many of the stocks in this ETF have a decades-long track record of recovering from even the most severe economic rough patches while still paying out consistent dividends to shareholders.

3. Its high dividend can generate passive income

Perhaps the biggest advantage of investing in a dividend ETF is the dividend income itself. This fund most recently paid out a quarterly dividend of around $0.84 per share, and while that may not sound significant, it adds up when you accumulate dozens or hundreds of shares over time.

Dividend ETFs can be particularly strong investments during periods of market uncertainty. Besides the general consistency and diversification that this fund offers, you can also rely on it as a steady source of passive income via dividend payments. While you can reinvest those dividends back into the fund, you can also choose to cash them out each quarter for some extra income.

High-yield dividend funds specifically are designed to pay higher dividends compared to other stocks and ETFs. If you’re looking to grow a stable stream of passive income, the Vanguard High Dividend Yield ETF can help you get there.

It’s unclear where the stock market may be headed throughout the rest of 2025. But during periods of uncertainty, investing in a dividend ETF can help keep your portfolio more protected, regardless of what’s coming.

Katie Brockman has positions in Vanguard S&P 500 ETF. The Motley Fool has positions in and recommends Vanguard S&P 500 ETF and Vanguard Whitehall Funds – Vanguard High Dividend Yield ETF. The Motley Fool has a disclosure policy.

Source link

The Best Dividend ETF to Invest $1,000 in Right Now

This high-quality ETF can be a reliable source of income for investors.

I never shy away from a chance to tell someone how lucrative dividend stocks can be. Reliable distributions may not be as fun to brag about as share price appreciation, but they can quietly help you build wealth, particularly if you reinvest them to benefit from compound growth. And succeeding with an income investment strategy doesn’t require the acumen of a Wall Street veteran, either. It can be as simple as investing in a dividend-focused exchange-traded fund (ETF).

There are numerous worthwhile dividend ETFs on the market, but if you’re looking for one to invest $1,000 in now, I say look no further than the Schwab U.S. Dividend Equity ETF (SCHD -1.67%). It checks off many of the boxes that dividend investors should have on their lists.

Rolled $100 bills planted in soil.

Image source: Getty Images.

A good vetting process

One of the boxes the Schwab U.S. Dividend Equity ETF checks off (and arguably the most important one) is that it contains only high-quality companies. It tracks the Dow Jones U.S. Dividend 100, and entry into that index requires that companies have consistent cash flow, a strong balance sheet, a track record of at least 10 years of dividend payouts, and strong profitability.

These criteria mean that its components aren’t picked solely based on their dividends, and that they’re unlikely to be yield traps — stocks where the yields are high (and thus, attractive on the surface) because their share price has declined meaningfully due to poor business performance.

This doesn’t mean companies in this ETF won’t ever face challenges, but they have businesses built to withstand them. Below are the fund’s top 10 holdings:

Company Weight in the ETF’s Portfolio
AbbVie 4.35%
Lockheed Martin 4.25%
Merck 4.22%
Amgen 4.14%
Cisco Systems 4.07%
ConocoPhillips 4.01%
Altria Group 3.92%
Chevron 3.90%
Coca-Cola 3.83%
Home Depot 3.82%

Source: Charles Schwab. Percentages as of Oct. 7.

These companies aren’t the high-flying tech stocks that get a lot of attention in the media and on Wall Street, but they’re reliable, generate consistent cash flows, and have proven that their businesses can hold up during tough economic times. That’s always important, but it’s especially so with dividend stocks, which provide much of their long-term value to shareholders by steadily distributing profits.

A dividend that will grow over time

Not only do the Schwab U.S. Dividend Equity ETF’s criteria rule out companies with shaky or unstable dividends, they also favor companies that prioritize regularly increasing their payouts. Over the past decade, the ETF’s dividend per share has increased by 187% to $0.26 per quarter.

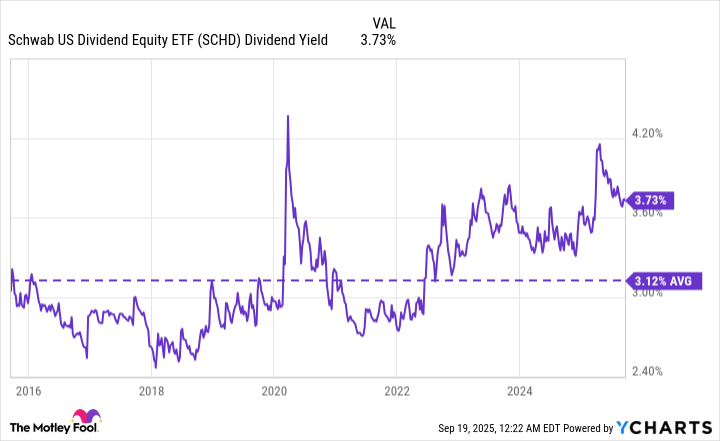
At the ETF’s price at the time of this writing, that works out to around a 3.8% yield, meaningfully above its average over the past decade.

SCHD Dividend Yield Chart

SCHD Dividend Yield data by YCharts.

Although the Schwab U.S. Dividend Equity ETF’s dividend yield will inevitably fluctuate as the prices of the stocks in its portfolio do, if we assume it remains around 3.8%, that would pay out around $38 annually per $1,000 invested. That’s not life-changing money. However, it can add up over time, especially if you reinvest your dividends and focus on acquiring more shares.

How much could a $1,000 become worth?

There’s no way to predict how a stock or ETF will perform, but for the sake of illustration, let’s assume the Schwab U.S. Dividend Equity ETF continues to deliver at the same pace it has averaged over the past decade: an average annualized total return of 11.7%. At that rate, here is roughly how much a $1,000 investment would be worth after various periods (accounting for SCHD’s 0.06% expense ratio):

  • 10 years: $3,007.
  • 15 years: $5,215.
  • 20 years: $9,044.
  • 25 years: $15,685.

Those are impressive gains, but your results would be even better if you steadily invested more money in it over time. Adding $100 a month would give you a holding worth around $23,700 in 10 years, $48,670 in 15 years, $91,980 in 20 years, and $167,080 in 25 years. Those are huge differences from just the one-time $1,000 investment.

Nothing is guaranteed in the stock market, but the Schwab U.S. Dividend Equity ETF has a track record of being a great choice for investors seeking reliable and consistent income.

Stefon Walters has positions in Coca-Cola. The Motley Fool has positions in and recommends AbbVie, Amgen, Chevron, Cisco Systems, Home Depot, and Merck. The Motley Fool recommends Lockheed Martin. The Motley Fool has a disclosure policy.

Source link

The Best Dividend ETF to Buy as Washington Stalls

Shutdowns happen, but markets hold up. This ETF will help you ride it out.

Even though we’ve been through this before, the U.S. government shutdown can be an unsettling time. Swaths of federal employees are off the job — or still working but not being paid — and it’s unclear how long the deadlock will last.

At the same time, it’s scary for non-government workers, too. We rely on the government for Social Security checks, Medicare, Medicaid, veterans’ benefits, and for much-needed services such as air traffic control.

People will still get their checks and veterans’ benefits, but some services will be delayed. And travelers are already reporting delays and cancelled flights at airports.

Fortunately, the stock market has a history of holding its own during a government shutdown. Keeping your money in the market has traditionally been a smart move. And if you’re worried about making sure you have a steady flow of income, a dividend exchange-traded fund (ETF) like the Vanguard Dividend Appreciation ETF (VIG -1.92%) can be a good option.

Mount Rushmore with a fence and a

Image source: Getty Images.

About the Vanguard ETF

First, it’s important to understand why the Vanguard Dividend Appreciation ETF includes the stocks it does. And to do that, you have to understand the principles of the underlying index, which is the Nasdaq US Dividend Achievers Select Index.

This index includes companies that are on the Nasdaq US Broad Dividend Achievers Index, with some important exceptions. First, it excludes the top 25% of companies in the index by dividend yield. That’s to make sure the Nasdaq US Dividend Achievers Select Index doesn’t have unstable companies with dividends that are artificially high because their businesses are unstable.

And second, the fund excludes all master limited partnerships and real estate investment trusts. Lastly, it only includes companies that have increased their dividend annually for at least 10 consecutive years.

The stocks left make up the Nasdaq US Dividend Achievers Select Index, and those names are skewed toward the technology, industrial, and financial sectors, which account for a collective 64% of the fund.

That’s the index that the Vanguard ETF strives to duplicate, so you can find the same breakdown by stock and sector in it. The top 10 holdings are all blue chip names, with no stock having more than a 6% weighting.

Holding

Portfolio Weight

1-Year Return

Dividend Yield

Broadcom

5.95%

91.2%

0.70%

Microsoft

4.8%

27.8%

0.69%

JPMorgan Chase

4%

49%

1.95%

Apple

3.7%

13.6%

0.41%

Eli Lilly

2.8%

-4.1%

0.71%

Visa

2.7%

26.5%

0.67%

ExxonMobil

2.4%

-5.3%

3.47%

Mastercard

2.3%

16.9%

0.52%

Johnson & Johnson

2.1%

20.5%

2.75%

Walmart

2%

28%

0.91%

Source: Morningstar

Only two of these companies in the Vanguard Dividend Appreciation ETF’s top 10 are in the red after 12 months. That’s the beauty of an ETF: Rather than trying to guess the one or two best stocks to buy, you get an entire bushel of them with the Vanguard ETF.

The other thing I really like about this ETF is that it gives you a good mix of performance and yield. Compared to some other popular dividend ETFs, it provides the best one-year performance, with a gain of 10%. Combine that with a dividend yield of 1.6%, and you get a nice total return from Vanguard Dividend Appreciation.

VIG Chart

VIG data by YCharts.

The bottom line

Yes, this can be an unsettling time, and it’s only natural to make sure that you’re investing in a fund that can provide you with some guaranteed quarterly income, especially if you’re worried that you’re going to have to cover a shortfall by another source.

The Vanguard Divided Appreciation ETF provides the best combination of dividend payout and one-year performance. And when you also consider that it has a low expense ratio of only 0.05%, or $5 annually per $10,000 invested, then I’m comfortable parking funds here while waiting for the government to restart.

JPMorgan Chase is an advertising partner of Motley Fool Money. Patrick Sanders has no position in any of the stocks mentioned. The Motley Fool has positions in and recommends Apple, JPMorgan Chase, Mastercard, Microsoft, Vanguard Dividend Appreciation ETF, Vanguard Whitehall Funds-Vanguard High Dividend Yield ETF, Visa, and Walmart. The Motley Fool recommends Broadcom and Johnson & Johnson and recommends the following options: long January 2026 $395 calls on Microsoft and short January 2026 $405 calls on Microsoft. The Motley Fool has a disclosure policy.

Source link

Could Buying $10,000 of This Generative Artificial Intelligence (AI) ETF Make You a Millionaire?

This exchange-traded fund is loaded with potential generative AI winners.

Some of the biggest winners in the stock market over the last three years have been companies riding the rising wave of generative artificial intelligence.

Palantir (PLTR -5.39%), with its artificial intelligence platform, has seen its stock rise by over 2,000% in three years. Nvidia (NVDA -4.84%), the poster child for AI chipmakers, is up by more than 1,300% in the same period. And neo-cloud providers like Nebius Group (NBIS -2.37%) and CoreWeave (CRWV -3.32%) have soared by triple-digit percentages since their IPOs.

If you had invested $10,000 in any one of these big winners ahead of their surges, you’d be well on the way to having a million-dollar holding in the long term, even if they produce merely average returns from here on out. But identifying which companies will be a new technology’s big winners ahead of time is difficult. If it were easy, everyone would be rich.

If you’d like to profit from the ongoing growth of AI, you could put a little bit of money into a lot of different AI stocks, or you could buy an ETF that specializes in finding generative AI opportunities. That’s what the Roundhill Generative AI & Technology ETF (CHAT -5.03%) does. Investors who are still trying to strike it rich with generative AI stocks may find it a compelling alternative to attempting to pick individual AI stocks themselves.

A person holding a phone displaying a login screen for an AI chatbot.

Image source: Getty Images.

Looking under the hood

The Roundhill team is focused on building a portfolio of companies that are actively involved in the advancement of generative AI. Its holdings include companies developing their own large language models and generative AI tools, companies providing key infrastructure for training and inference, and software companies commercializing generative AI applications.

Since it’s an ETF, investors can see exactly what the fund holds. Here are the largest holdings in the portfolio as of this writing.

  • Nvidia
  • Alphabet
  • Oracle
  • Microsoft
  • Meta Platforms
  • Broadcom
  • Tencent Holdings
  • Alibaba Group Holdings
  • ARM Holdings
  • Amazon

There aren’t a lot of surprises in the list. Perhaps the biggest standout is Arm, which is relatively small compared to the other tech giants with large weightings in the portfolio. Still, its market cap comes in at a healthy $165 billion.

In total, the ETF holds 40 stocks and several currency hedges for foreign-issued shares as of this writing. That diversification gives it a good chance of holding a few companies that will be big winners from here, which may be all it takes to produce market-beating returns. Indeed, the portfolio includes some of the best-performing stocks of 2025, including Palantir.

Since its inception in 2023, the Roundhill Generative AI & Technology ETF has returned an impressive 148% compared to a 66% total return from the S&P 500. And that’s factoring in the drag of the ETF’s 0.75% expense ratio.

Could $10,000 invested make you a millionaire?

In order to turn $10,000 into $1 million, the ETF would have to increase in value 100-fold. That may be difficult, considering the current sizes of its top holdings.

Nearly one-third of the portfolio is invested in companies with market caps exceeding $1 trillion, and the larger a company becomes, the more raw growth it takes to move the needle on its size on a percentage basis. For Nvidia to grow by even 25% now would be the equivalent of creating a whole new trillion-dollar business. And while such growth is certainly possible for some of those megacap companies, there’s still a finite amount of money in the global economy.

Meanwhile, there are only a handful of relatively small businesses in the ETF’s portfolio that could reasonably be expected to multiply in size significantly.

Additionally, many stocks in the portfolio have high valuations. Palantir shares trade for a forward P/E ratio of 280. Nebius trades for 54 times expected sales. Even CoreWeave’s sales multiple of 12.5 looks expensive, given its reliance on debt to continue growing. That said, some of the best performers of the last few years also looked expensive a few years ago (including Palantir and Nvidia). Still, the expected return of stocks with such high valuations isn’t going to be as high as those offering more compelling values.

As such, it seems unlikely the Roundhill Generative AI & Technology ETF will produce returns strong enough to turn $10,000 into $1 million over a reasonable time frame. That doesn’t mean that it’s not worth owning. For investors looking to gain exposure to the generative AI trend without going all in on one or two stocks, buying the Roundhill Generative AI & Technology ETF is a simple way to do that.

Adam Levy has positions in Alphabet, Amazon, Meta Platforms, and Microsoft. The Motley Fool has positions in and recommends Alphabet, Amazon, Meta Platforms, Microsoft, Nvidia, Oracle, Palantir Technologies, and Tencent. The Motley Fool recommends Alibaba Group, Broadcom, and Nebius Group and recommends the following options: long January 2026 $395 calls on Microsoft and short January 2026 $405 calls on Microsoft. The Motley Fool has a disclosure policy.

Source link

Wealth Manager Builds Position in VanEck Semiconductor ETF (SMH) With 8,900 Shares Worth $2.9M

On October 7, 2025, Moulton Wealth Management, Inc disclosed a new position in VanEck Semiconductor ETF(SMH 2.68%), acquiring 8,932 shares valued at approximately $2.92 million.

What happened

According to a Securities and Exchange Commission (SEC) filing dated October 7, 2025, Moulton Wealth Management, Inc disclosed a new position in VanEck Semiconductor ETF, adding 8,932 shares. The estimated transaction value was approximately $2.92 million. The fund reported 45 total positions and $137.49 million in reportable U.S. equity assets.

What else to know

This is a new position; SMH now accounts for 2.1% of the fund’s 13F assets under management.

Top holdings after the filing:

  • SPLG: $12.93 million (9.4% of AUM)
  • USFR: $10.40 million (7.6% of AUM)
  • TFLO: $10.37 million (7.5% of AUM)
  • SJNK: $9.82 million (7.1% of AUM)
  • FLOT: $9.73 million (7.1% of AUM)

As of October 7, 2025, shares were priced at $337.05, up 35.79% over the past year.

Company overview

Metric Value
Dividend Yield 0.32%
Price (as of market close October 7, 2025) $337.05
1-Year Price Change 35.79%

Company snapshot

The investment strategy seeks to replicate the performance of the fund’s benchmark index by investing at least 80% of assets in U.S. exchange-listed semiconductor companies.

The portfolio is concentrated in common stocks and depositary receipts of semiconductor companies, including both domestic and foreign issuers.

Fund structure is non-diversified with a passively managed approach.

VanEck Semiconductor ETF (SMH) provides targeted exposure to the semiconductor sector by tracking a benchmark index of leading U.S.-listed semiconductor companies. The fund’s substantial asset base and focused portfolio offer investors a liquid and efficient vehicle for accessing this critical technology industry.

Foolish take

I’m a longtime bull on the VanEck Semiconductor ETF (SMH) for one very simple reason: Semiconductors are a critical component within the artificial intelligence (AI) ecosystem, and AI is the most important technological innovation of this decade.

Therefore, this fund’s core holdings read like a who’s who of top-performing stocks. There’s Nvidia, Advanced Micro Devices, Broadcom, Taiwan Semiconductor Manufacturing, Intel, and many more.

Obviously, many of these stocks have soared to new heights as the AI revolution has picked up steam. Nvidia is now the world’s largest company by market cap; Broadcom is now the 7th-largest American company with a market cap north of $1.6 trillion.

What’s more, organizations are still spending tens of billions on new AI infrastructure investments — much of it coming in the form of purchases of semiconductors.

For example, according to estimates compiled by Yahoo Finance, Nvidia’s annual sales should rise to over $200 billion this year, up from $26 billion in 2022.

All that said, semiconductors have historically been a cyclical industry, and have endured many boom-bust cycles. So investors should remain cautious about how much exposure they may have to the semiconductor industry, given its volatile history.

However, for most growth-oriented investors, semiconductors are now a must-own sector. So for those investors, the Van Eck Semiconductor ETF is one fund to consider for the long term.

Glossary

ETF (Exchange-Traded Fund): An investment fund traded on stock exchanges, holding assets like stocks or bonds.

13F assets under management: The value of U.S. equity securities reported by institutional managers in quarterly SEC filings.

New position: The initial purchase of a security or asset not previously held in a portfolio.

Benchmark index: A standard index used to measure the performance of an investment fund or portfolio.

Depositary receipts: Negotiable certificates representing shares in a foreign company, traded on local stock exchanges.

Non-diversified fund: A fund that invests a large portion of assets in a small number of issuers or sectors.

Passively managed: An investment approach that aims to replicate the performance of a benchmark index, not outperform it.

Expense ratio: The annual fee expressed as a percentage of assets, covering a fund’s operating costs.

Asset base: The total value of assets held by a fund or investment vehicle.

Reportable position: A holding that must be disclosed in regulatory filings due to its size or regulatory requirements.

Jake Lerch has positions in Nvidia and VanEck ETF Trust – VanEck Semiconductor ETF. The Motley Fool has positions in and recommends Advanced Micro Devices, Intel, Nvidia, and Taiwan Semiconductor Manufacturing. The Motley Fool recommends Broadcom and recommends the following options: short November 2025 $21 puts on Intel. The Motley Fool has a disclosure policy.

Source link

Where Will iShares Ethereum Trust ETF Be in 5 Years?

Wondering where Ethereum and its ETFs are headed? Here’s what the five-year roadmap says about fees, network speed, global adoption, and investor value.

You know what Yoda would say if you asked him what Ethereum (ETH -4.29%) will do in the next five years: “Difficult to see. Always in motion, the crypto market is.” As always, the Jedi master would be absolutely right.

And if you changed your focus to an exchange-traded fund (ETF), like the sector-leading iShares Ethereum Trust ETF (ETHA -5.28%), he’d just shake his head and take a nap. Whatever Ethereum might do, the iShares fund will copy in detail. It doesn’t make sense to analyze the cryptocurrency and the ETF separately. Right?

Then again, Yoda couldn’t have foreseen cryptocurrencies — and the first ETF was launched years after his passing. I still agree that nobody knows everything that will happen to these assets by the year 2030, but I do have some clues to Ethereum’s general direction, and the ETF deserves another layer of analysis.

What Vitalik Buterin wants to build by 2030

At an Ethereum developers conference in September, the keynote from founder Vitalik Buterin provided a helpful overview of what’s happening in this cryptocurrency over the next few years.

Users and app developers will see lower usage fees and faster execution of Ethereum’s smart contracts. More to the point, the underlying global computer network will continue to grow more scalable, ultimately able to handle massive workloads without blinking.

The scaling effort isn’t limited to pure Ethereum upgrades. It also involves several Layer-2 (L2) blockchains that accelerate the central Ethereum network’s performance. Importantly, it should eventually be easy to move data and app links from one L2 platform to another. Today, leading L2 systems like Arbitrum and Optimism are fast on their own, but difficult to use together. That separation is up for change.

As a result, the overall user experience should grow smoother. The end goal is to make Ethereum-based apps just as common and natural as the Java, Python, and C# apps you’re using today. If none of those programming language names meant anything to you, that proves my point about the user-friendly experience. That’s what the Ethereum community wants to build someday: a platform you’re using all the time without knowing or caring about it.

And for those who do care about the technical guts, Buterin envisions a more decentralized Ethereum network with lower hardware requirements for running a node. This goal only matters to Ethereum’s insiders — except that more decentralization will ultimately support a better user experience. When your next Ethereum transaction can be verified by laptops and smartphones, you’re looking at a pretty slick Ethereum experience.

A large pile of gold coins with the Ethereum logo.

Image source: Getty Images.

Transaction fees are where the money is

I can boil the user-oriented improvements down to an investment thesis. Five years from now, Ethereum will be much more powerful and easier to use, to the point where most people might interact with it every day, and it’s no big deal. The actual large-scale adoption may take longer, but the technical platform will be there by 2030.

And that’s where Ethereum starts to build real value for its investors — more usage equals higher prices.

Remember, this cryptocurrency isn’t designed to preserve wealth in a secure asset with strictly limited supply. That would be Bitcoin. Instead, its blockchain ledger holds transactions used in real-world apps. Its ledger and smart contracts can manage financial accounts, hold ownership records for virtual or physical assets, and generally provide the digital data connections needed to run a modern application on a global scale.

Each transaction generates a tiny fee, adding value to the Ethereum coin. Widespread adoption of Ethereum’s tools should generate massive growth in the generation of these fees.

That’s exactly what the user-focused platform upgrades are meant to do over time.

So I won’t put a firm price target on Ethereum in 2030, but I do expect it to gain value. Anything less would be a massive failure of the Ethereum vision, the Web3 concept, and modern data management in general.

Why the ETF wrapper actually matters

And the ETF structure really can change how investors approach Ethereum:

  • The iShares Ethereum Trust ETF behaves much like any other stock or ETF. You can buy it through your stock brokerage and hold it in your regular portfolio, even if it’s a tax-advantaged retirement account like an IRA. You can’t do that with a raw Ethereum coin (yet, anyway).

  • The ETF structure is wrapped in extra layers of regulation, making institutional investors and billionaires more comfortable with the cryptocurrency.

  • Just like Ethereum itself, the ETFs can add new features over time. For example, the Grayscale Ethereum Trust (ETHE -5.30%) just enabled staking of its Ethereum holdings. That’s a dividend-like 3% annual return that didn’t exist last week. These innovations can help one ETF steal market share from its peers.

Five years from now, I expect a juicier price tag on Ethereum coins as the underlying technology slowly becomes a normal (and often ignored) part of everyday life. The iShares Ethereum Trust ETF will largely follow along, providing a more convenient buying system for traditional investors — and perhaps a couple of new features along the way. How long will it take before all the Ethereum ETFs come with dividend-style staking enabled?

Crypto is “always in motion,” but now you can tell Yoda where Ethereum and its ETFs are going in five years. The destination is more real-world usage and higher value, all wrapped in a handy ETF if you prefer.

Anders Bylund has positions in Bitcoin, Ethereum, and iShares Ethereum Trust – iShares Ethereum Trust ETF. The Motley Fool has positions in and recommends Bitcoin and Ethereum. The Motley Fool has a disclosure policy.
Source link

Don’t Miss Out on This $30-Trillion Dollar Sector: The Top ETF to Buy

Roughly half of all U.S. stocks pay dividends, making it a huge investable universe, with this one ETF letting you buy the best of the best.

The U.S. market is huge, with a combined market cap of around $63 trillion. There are all sorts of different ways you can slice and dice the U.S. stock market, with the top ETFs offering plenty of variety. But if you are a dividend lover, you are only interested in about half of the total universe, which cuts your investable universe down to “just” $30 trillion or so.

If that’s still a little daunting (it should be), then you need to get to know Schwab US Dividend Equity ETF (SCHD -0.39%). Here’s why it could be the top dividend exchange-traded fund (ETF) for you to buy.

A finger turning blocks that spell out ETF.

Image source: Getty Images.

What does Schwab US Dividend Equity ETF do?

Schwab US Dividend Equity ETF tracks the Dow Jones U.S. Dividend 100 Index. Although the exchange-traded fund technically doesn’t do anything other than mimic the index, the index and the ETF are, in practice, doing the same things and can be discussed interchangeably. From here on out, the ETF will be discussed and not the index.

The first step in creating Schwab US Dividend Equity ETF’s portfolio is to winnow down the $30 trillion worth of dividend stocks to a more manageable number. To do this, only stocks that have increased their dividends for at least 10 years are examined for further consideration. Also eliminated are real estate investment trusts (REITs), because of their unique corporate structure that emphasizes dividends and avoids corporate-level taxation.

Once a core investable universe is created, Schwab US Dividend Equity ETF builds a composite score for each of the remaining companies. The score includes cash flow to total debt, return on equity, dividend yield, and a company’s five-year dividend growth rate. Essentially, the ETF is trying to find financially strong companies that are well run and that return material value to shareholders via regular, and growing, dividend payments. The 100 companies with the best composite scores are included in the ETF.

The ETF uses a market cap weighting approach, so the largest companies have the biggest impact on performance. And the list of holdings is updated annually. That’s a lot of work, but the expense ratio is a very modest 0.06%. At the end of the day, Schwab US Dividend Equity ETF is doing what most dividend investors would do if they bought stocks on their own at a cost that is very close to free by Wall Street standards.

Why you should buy Schwab US Dividend Equity ETF

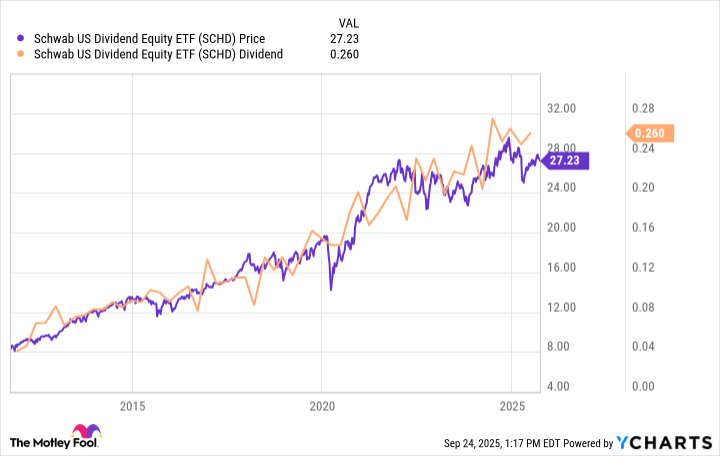
Some caveats are important here. You can easily find higher-yielding ETFs. You can easily find ETFs that have had better price appreciation. Simply put, Schwab US Dividend Equity ETF isn’t a perfect investment choice for every investor. But it provides a very good balance between yield, price appreciation, and dividend growth over time.

SCHD Chart

SCHD data by YCharts

As the chart above highlights, the dividend and the ETF’s market price have both trended generally higher since its inception in October 2011. Now add in the well-above-market dividend yield of around 3.7% today, and the story gets even better. For reference, that’s just over three times greater than what you’d collect from an S&P 500 index (^GSPC 0.26%) tracking ETF like Vanguard S&P 500 ETF (NYSEMKT: VOO).

And since Schwab US Dividend Equity ETF’s portfolio is regularly updated, you don’t need to think about what’s in the portfolio. How it invests is more important than what it owns at any given moment. Its holdings will naturally shift along with the market over time. In other words, you just have to make one buy decision and let the ETF do the rest of the work for you.

A simple “one and done” ETF for dividend investors

There are a lot of public companies in the United States. And around half of those public companies pay dividends. Schwab US Dividend Equity ETF lets you cut through the $30 trillion worth of dividend noise to focus on just 100 of the best dividend stocks. And it basically picks dividend stocks the way a dividend investor would do it, looking for quality companies with growing businesses, attractive yields, and growing dividends. If you love dividends, Schwab US Dividend Equity ETF could easily be the top ETF for you.

Source link

This Supercharged Vanguard ETF Could Turn $100 Per Month Into $2 Million

With this ETF, you could become a millionaire while barely lifting a finger.

Investing in the stock market is one of the most surefire ways to build life-changing wealth, and the right investment can transform your savings.

Owning an exchange-traded fund (ETF) is a fantastic way to gain exposure to high-growth stocks with minimal effort on your part. A single ETF can contain dozens or hundreds of stocks, and you’ll own a stake in all of them by owning just one share of that fund.

If you’re looking for a high-powered ETF with a history of earning significantly above-average returns, the Vanguard Information Technology ETF (VGT 0.29%) could potentially turn just $100 per month into $2 million or more over time. Here’s how.

Person pulling hundred-dollar bills out of a wallet.

Image source: Getty Images.

A simple way to invest in tech stocks

The technology sector has a long track record of outperforming the market, and investing in a tech-focused ETF — like the Vanguard Information Technology ETF — can make it easier to invest in these stocks without having to research dozens of individual companies.

One of this ETF’s major strengths is its balance between industry-leading giants and smaller corporations. Around 44% of this fund is allocated to Nvidia, Microsoft, and Apple — the three largest holdings by a substantial margin. But it also contains an additional 313 stocks from all corners of the technology sector.

Major companies like Nvidia, Microsoft, and Apple are often more stable than their smaller counterparts. While they can still face significant volatility during economic rough patches, they’re very likely to recover and go on to see positive total returns over the long term.

Up-and-coming companies can be shakier than the industry titans, but these stocks also have more potential for explosive growth. If even one of them becomes the next tech powerhouse, investing now could set you up for substantial gains.

Building a $2 million portfolio

There are never any guarantees in the stock market, and past performance doesn’t predict future returns. That said, it can sometimes be helpful to look at historical returns to get an idea of roughly how much you might earn with a particular investment.

Over the last 10 years, the Vanguard Information Technology ETF has earned an average rate of return of more than 22% per year. For context, the market itself has earned an average return of around 10% per year over the last 50 years.

Again, this ETF may or may not continue earning 22% average annual returns. So to play it safe, let’s assume that going forward, you could earn either a 22%, 16%, or 11% average annual return. If you were to invest $100 per month, here’s approximately what you could accumulate over time.

Number of Years Total Portfolio Value: 22% Avg. Annual Return Total Portfolio Value: 16% Avg. Annual Return Total Portfolio Value: 11% Avg. Annual Return
15 $102,000 $62,000 $41,000
20 $286,000 $138,000 $77,000
25 $781,000 $299,000 $137,000
30 $2,120,000 $636,000 $239,000

Data source: Author’s calculations via investor.gov.

To build a portfolio worth $2 million or more, you’d need to invest consistently for around 30 years while earning returns in line with this ETF’s 10-year average. But even if you can’t invest that long or this fund underperforms in the future, you could still rack up hundreds of thousands of dollars over time.

Keep in mind, too, that if you decide to invest in this ETF, double-check that the rest of your portfolio is well-diversified. While this fund has a diverse assortment of tech stocks, investing in just one sector of the market — especially an industry as volatile as tech — increases risk.

Technology ETFs can supercharge your net worth with next to no effort on your part. By starting early and investing consistently, the Vanguard Information Technology ETF could turn small monthly contributions into millions.

Katie Brockman has positions in Vanguard Information Technology ETF. The Motley Fool has positions in and recommends Apple, Microsoft, and Nvidia. The Motley Fool recommends the following options: long January 2026 $395 calls on Microsoft and short January 2026 $405 calls on Microsoft. The Motley Fool has a disclosure policy.

Source link

Prediction: The Vanguard Total Stock Market Index Fund ETF Will Soar Over the Next 20 Years. Here’s the No. 1 Reason Why.

The long-term data for stock market returns paints a clear picture.

The Vanguard Total Stock Market Index Fund ETF (VTI 0.21%) is one of the most popular exchange-traded funds (ETFs) on the planet. The fund has net assets of nearly $2 trillion.

With stock indexes hovering near all-time highs, many investors are worried that this historically successful ETF will struggle in the years to come. But there’s one critical piece of data that suggests otherwise.

This ETF remains a data-backed investment

The Vanguard Total Stock Market Index Fund ETF is a classic pick for savvy long-term investors. That’s because the ETF tracks the holdings of the CRSP US Total Market Index, which includes almost every type of company imaginable — everything from small-caps and large-caps to value stocks and growth stocks.

The ETF is incredibly diversified with more than 3,000 holdings, but investors should note that only U.S. companies are included. Many of those U.S. companies, however, have global operations, providing some level of international diversification.

Person cheering on a stock market trading floor.

Image source: Getty Images.

With an expense ratio of just 0.03%, the Vanguard Total Stock Market Index Fund ETF is one of the cheapest ways investors can get broad access to nearly the entire stock market. But with the indexes already at all-time highs, is this ETF still a smart pick? If your holding period is 20 years or more, the answer is absolutely. That’s because there has never been a 20-year period where the U.S. stock market has posted a negative return.

Of course, returns for any given 20-year period vary widely. But here’s a good example of how buying market indexes like this, even at their peaks, is a wise long-term decision. If you purchased shares of VTI in 2007 at their pre-cash peak, you still would have accumulated a 338% return over the next 18 years. So long-term investors can rejoice: The Vanguard Total Stock Market Index Fund ETF remains a solid pick for the decades ahead.

Ryan Vanzo has no position in any of the stocks mentioned. The Motley Fool has positions in and recommends Vanguard Total Stock Market ETF. The Motley Fool has a disclosure policy.

Source link

Warren Buffett Says to Buy This Vanguard ETF. It Could Turn $1,000 per Month Into $264,000 in 10 Years.

Investing with a simple and consistent approach can result in a fantastic outcome.

It’s probably safe to say that the world hasn’t seen a better capital allocator than Warren Buffett. His incredibly long track record running Berkshire Hathaway speaks for itself, as his investment prowess transformed the company into a $1 trillion conglomerate.

Average investors are right to listen to Buffett’s advice. And one of his recommendations is extremely simple. The Oracle of Omaha says to buy this Vanguard exchange-traded fund (ETF). It could turn a monthly $1,000 investment into $264,000 in a decade.

S&P 500 in front of gold bars with red down arrow and green up arrow.

Image source: Getty Images.

Simple is best

Every investor wants to be like Buffett, picking individual businesses based on expert financial analysis skills. However, this is obviously not something everyone can do. Even professional money managers struggle to find success, with many funds lagging the overall market.

Buffett believes that most retail investors are better off taking a simpler approach. This means buying a low-cost ETF that tracks the performance of the S&P 500, such as the Vanguard S&P 500 ETF (VOO -0.56%). It carries an extremely low expense ratio of 0.03%, which is probably why Buffett is so supportive of it.

What’s more, investors are buying an ETF offered by a leading firm in the asset management industry that has been around since 1975. Vanguard had $11 trillion in total assets under management as of July 31, highlighting its tremendous scale and the amount of capital it’s trusted to handle.

The Vanguard S&P 500 ETF tracks the performance of the S&P 500. Investors in the fund get exposure to 500 large and profitable companies, with tech behemoths like Nvidia, Microsoft, and Apple having big weights. However, there is still broad diversification, as all sectors of the economy are represented.

Owning this ETF essentially means that investors are betting on the ongoing growth and ingenuity of the U.S. economy. That doesn’t mean there isn’t international exposure. Many of the companies in the S&P 500 generate revenues from overseas markets. This can be beneficial as other countries potentially register more growth than the U.S. in the long run.

Stellar performance

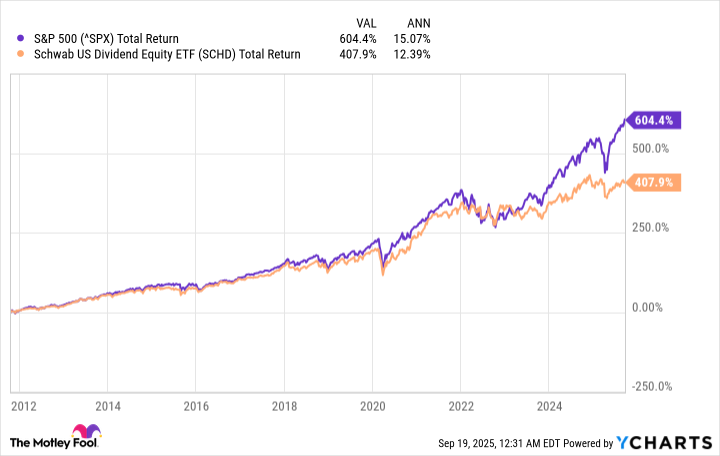
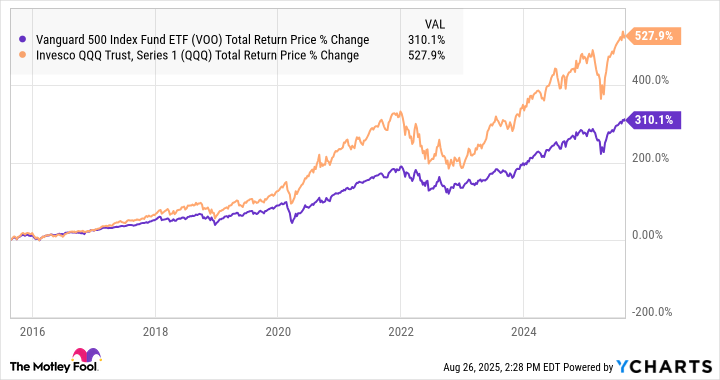
In the past decade, the S&P 500 has generated a total return of 304% (as of Sept. 19). On an annualized basis, this translates to a gain of 15%. It’s hard to complain with this performance, which has been driven by historically low interest rates, lots of passive capital flowing into the stock market, and the rise of massive tech companies.

If trailing-10-year returns (from August 2015 to August 2025) repeated over the next decade, investing $1,000 monthly into the Vanguard S&P 500 ETF would turn into $264,000 by September 2035. This proves that even small sums of money can result in huge returns over the long term.

This approach is considered dollar-cost averaging, and it works so well because investors are building a consistent habit of allocating capital to their portfolios. Plus, it lessens the importance of trying to correctly time the market, which is a losing proposition.

But to be clear, past returns provide no guarantee of future results. Looking out over the next decade, the Vanguard S&P 500 ETF could generate worse performance than it did since 2015. This is entirely in the realm of possibilities. One area of concern is the historically expensive valuation of the S&P 500, which might be one of the main reasons Buffett and Berkshire have been net sellers of stocks in recent years.

It’s best to have realistic expectations. While the returns could be great, it’s also possible that the S&P reverts back to its long-run average of 10% yearly gains. Either way, buying the Vanguard S&P 500 ETF on a monthly basis is perhaps one of the best things investors can do, at least in Buffett’s opinion.

Neil Patel has positions in Vanguard S&P 500 ETF. The Motley Fool has positions in and recommends Apple, Berkshire Hathaway, Microsoft, Nvidia, and Vanguard S&P 500 ETF. The Motley Fool recommends the following options: long January 2026 $395 calls on Microsoft and short January 2026 $405 calls on Microsoft. The Motley Fool has a disclosure policy.

Source link

The Smartest Dividend ETF to Buy With $1,000 Right Now

When it comes to making money in the stock market, stock price appreciation gets a lot of attention because it’s the most straightforward way to do so. You buy a stock for one price, sell it for a higher price, and make a profit. Simple enough. However, dividends can be just as effective at making money from stocks in many cases.

Assuming you’re investing in high-quality stocks or exchange-traded funds (ETFs), dividends are guaranteed income that investors can rely on quarterly (or monthly in some cases). Dividends can be an added plus when a stock is growing, as well as a buffer when a stock is falling.

If you’re looking for a high-quality dividend ETF to add to your portfolio, you should consider the Schwab U.S. Dividend Equity ETF (SCHD 1.01%). A $1,000 investment today could go a long way with time and patience.

Hands over a laptop with the glowing word “DIVIDEND” surrounded by digital currency symbols.

Image source: Getty Images.

SCHD has a criteria fit for high-quality companies

The saying “Everything that glitters ain’t gold” also applies to dividend stocks. Just because a stock has a high dividend yield doesn’t mean it’s worth owning. In some cases, it could be a yield trap, where the dividend is only high because the stock price has dropped due to bad business performance.

Investing in SCHD removes much of the risk of a yield trap because of the criteria it takes to be included in the ETF. It tracks the Dow Jones U.S. Dividend 100 Index, and to be included, a company must have the following:

  • A strong balance sheet
  • Consistent cash flow
  • At least 10 years of dividend payouts
  • Strong profitability metrics (such as return on equity)

These criteria is a good vetting tool for investors, removing some of the need to do more in-depth research on the companies within the ETF. Some notable dividend kings (companies with at least 50 consecutive years of dividend increases) in the ETF are Coca-Cola, Altria, PepsiCo, Target, and Kimberly Clark.

A sustained high dividend yield

You shouldn’t solely focus on dividend yields because they fluctuate with stock price movements, but it’s still worth paying attention to the dividend yield a dividend-focused ETF is able to sustain. At the time of this writing, SCHD’s dividend yield is 3.7%. This is above its 3.1% average over the past decade, and around three times what the S&P 500 currently offers.

SCHD Dividend Yield Chart

SCHD Dividend Yield data by YCharts

At its current dividend yield, a $1,000 investment would pay around $37 annually. This isn’t early retirement type money, but it can snowball into meaningful income, especially if you take advantage of your brokerage platform’s dividend reinvestment plan (DRIP). With a DRIP, your broker will take the dividends SCHD pays you and automatically reinvest them to buy more shares of the ETF.

Add in the fact that SCHD has increased its payout by over 160% in the past decade and should continue to increase its payout over time, and you have a chance for a $1,000 investment to go a long way.

Don’t expect explosive stock price growth

Since SCHD hit the market in October 2011, it has underperformed the S&P 500, averaging 12.4% annual total returns compared to the index’s 15%. Despite the underperformance, those are returns that most investors would still be happy to receive.

^SPX Chart

^SPX data by YCharts

Past results don’t guarantee future performance, but for the sake of illustration, let’s assume the ETF continues to average 12% annual total returns. A single $1,000 investment today could grow to over $9,600 in 20 years. If you were to add just $100 monthly to the ETF, it would grow to over $96,000. And with a low 0.06% expense ratio, you can keep more of these gains in your pocket.

Source link

Got $5,000? This Dividend ETF Could Be a No-Brainer Buy

The Schwab U.S. Dividend Equity ETF offers an above-average yield while balancing safety and long-term stability.

If you have $5,000 you can afford to invest in the stock market, a good option is to put that money into an investment that can generate recurring dividend income, while also having the potential to rise in value in the long run. That can put your money to work in multiple ways, potentially accumulating gains over time while also generating some good cash flow for your portfolio.

Exchange-traded funds (ETFs) can be excellent options to consider because they can give you a balanced investment into many stocks, possibly even hundreds or thousands of them. That means you don’t have to worry about how individual stocks are doing.

From a dividend investor’s point of view, that also means you don’t have to worry about the dreaded risk that a company will announce a dividend cut or suspension. I’ve been there, and even investing in seemingly safe dividend stocks can still end up with disappointment later on. The best way to protect yourself against that is with a well-diversified dividend ETF.

A great option is the Schwab U.S. Dividend Equity ETF (SCHD -0.44%).

Two people putting money in a piggy bank.

Image source: Getty Images.

The Schwab U.S. Dividend Equity ETF offers a terrific yield

One of the most appealing features of this Schwab fund is undoubtedly its high dividend yield. At 3.7%, that’s a far higher payout than what you’d collect if you simply tracked the S&P 500, as its average yield is just 1.2%.

To put that into perspective, if you invested $5,000 into the ETF today, you could expect to collect approximately $185 in dividends over the course of an entire year. In comparison, however, a $5,000 investment in an ETF tracking the S&P 500 would only generate $60 per year, given the index’s low yield.

What’s great is that, because the fund invests in around 100 stocks, your eggs aren’t all in one basket and dependent on one or even a couple of high-yielding stocks.

The fund focuses on safe dividend stocks and keeps its fees minimal

The Schwab U.S. Dividend Equity ETF tracks the Dow Jones U.S. Dividend 100, an index that prioritizes quality and sustainability when it comes to dividends. It isn’t simply adding high-yielding stocks into its portfolio. Some of the big names in the Schwab portfolio include Verizon Communications, PepsiCo, and Chevron. These are blue chip dividend stocks that are known for not only regularly paying dividends, but also for growing their payouts over time. Not every stock will have the same robust background, but it’s a good indication of the quality of the dividend stocks the fund is invested in.

Another solid feature of the fund is that its expense ratio is just 0.06%. That means if you invested $5,000, your annual fees from holding the ETF would be just $3. That’s less than the price of a cup of coffee in most places, and in exchange, you get an investment with a diversified position in some of the best dividend stocks in the world.

A great ETF to buy and forget about

The Schwab U.S. Dividend Equity ETF isn’t a high-powered growth investment, but it can be a dependable investment to hold in your portfolio for many years. When the market was in turmoil in 2022 and the S&P 500 crashed, this Schwab fund’s total returns (which include reinvested dividends) were a negative 3%. That’s a far cry from the performance of the broad index, which lost 18% in value.

This year it’s been a different story, with the Schwab U.S. Dividend Equity ETF’s total returns coming in at just 2% versus nearly 14% for the S&P 500. That’s the trade-off that you often need to take when opting for safety and security. You’ll sacrifice some gains when times are good, but in return, you can minimize your losses when times are tough.

Along the way, you can still collect an above-average dividend from this ETF without incurring significant fees. That’s why the Schwab U.S. Dividend Equity fund can be a suitable option to hang on to for the long haul.

David Jagielski has no position in any of the stocks mentioned. The Motley Fool has positions in and recommends Chevron. The Motley Fool recommends Verizon Communications. The Motley Fool has a disclosure policy.

Source link

This Artificial Intelligence (AI) ETF Has Outperformed the Market By 2.4X Since Inception and Only Holds Profitable Companies

For well under $100, you can buy one share of this under-the-radar AI exchange-traded fund (ETF) that looks poised to continue to outperform the market.

For this article, I asked myself: Where would I start investing if I had less than $100 to invest?

A semiconductor labeled with

Image source: Getty Images.

An AI ETF that’s concentrated and full of leading and profitable companies

This answer to my question popped into my head: I’d want a concentrated exchange-traded fund (ETF) focused on leading and profitable companies heavily involved in artificial intelligence (AI), but with enough differences among themselves.

Why an ETF? Because I’d not want to put all my (investing) eggs in one basket.

Why AI? Because it’s poised to be the biggest secular trend in many decades or even generations.

Why concentrated? Because I believe if investors are going to buy a very diversified ETF, they might as well buy the entire market, so to speak, and buy an S&P 500 index ETF. Indeed, buying an S&P 500 index fund is a good idea for many investors, and recommended by investing legend Warren Buffett. That said, over the long run, I think an AI ETF full of only leading and profitable companies will beat the S&P 500 index.

Roundhill Magnificent Seven ETF (MAGS): Overview

And bingo! There is such an ETF — the Roundhill Magnificent Seven ETF (MAGS 1.92%). It has seven holdings — the so-called “Magnificent Seven” stocks: Alphabet (GOOG 4.38%) (GOOGL 4.53%), Amazon (AMZN 1.42%), Apple (AAPL 1.06%), Meta Platforms (META 1.18%), Microsoft (MSFT 1.01%), Nvidia (NVDA -0.10%), and Tesla (TSLA 3.54%). This ETF closed at $62.93 per share on Friday, Sept. 12.

These megacap stocks (stocks with market caps over $200 billion) were given the Magnificent Seven name a couple of years ago by a Wall Street analyst due to their strong growth and large influence on the overall market. The name comes from the title of a 1960 Western film.

Two other main traits I like about this ETF:

  • Its expense ratio is reasonable at 0.29%.
  • It provides equal-weight exposure to the seven stocks. At each quarterly rebalancing, the stocks will be reset to an equal weighting of about 14.28% (100% divided by 7).

Since its inception in April 2023 (almost 2.5 years), the Roundhill Magnificent Seven ETF has returned 160% — 2.4 times the S&P 500’s 65.9% return.

Roundhill Magnificent Seven ETF (MAGS): All stock holdings

Stocks are listed in order of current weight in portfolio. Keep in mind the ETF is rebalanced quarterly to make stocks equally weighted.

Holding No.

Company

Market Cap

Wall Street’s Projected Annualized EPS Growth Over Next 5 Years

Weight (% of Portfolio)

1 Year/ 10-Year Returns

1

Alphabet $2.9 trillion 14.7% 17.72% 55.9% / 677%

2

Nvidia $4.3 trillion 34.9% 15.00% 49.3% / 32,210%

3

Apple $3.5 trillion 8.8% 14.13% 5.6% / 812%

4

Tesla $1.3 trillion 13.4% 13.81% 72.3% / 2,270%

5

Amazon $2.4 trillion 18.6% 13.30% 22% / 762%
6 Meta Platforms $1.9 trillion 12.9% 13.16% 44.3% / 725%
7 Microsoft $3.8 trillion 16.6% 12.76% 20.3% / 1,250%

Overall ETF

N/A

Total net assets of $2.86 billion

N/A

100%

40.5% / N/A

N/A

S&P 500

N/A

N/A

N/A

19.2% / 300%

Data sources: Roundhill Magnificent Seven ETF, finviz.com, and YCharts. EPS = earnings per share. Data as of Sept. 12, 2025.

All these companies are profitable leaders in their core markets, and heavily involved in AI. Nvidia produces AI tech that enables others to use AI, while the other companies mainly use AI to improve their existing products and develop new ones.

Alphabet’s Google is the world leader in internet search. Its cloud computing business is No. 3 in the world, behind Amazon Web Services (AWS) and Microsoft Azure. The company also has other businesses, notably its driverless vehicle subsidiary, Waymo. (You can read here why I believe Nvidia is the best driverless vehicle stock.)

Nvidia is often described as the world’s leading maker of AI chips — and that it is. But it’s much more. It’s the world leader in supplying technology infrastructure for enabling AI. It’s also the global leader in graphics processing units (GPUs) for computer gaming.

Apple’s iPhone holds the No. 2 spot in the global smartphone market, behind Samsung. However, it dominates the U.S. market. The company’s services business is attractive, as it consists of recurring revenue and has been steadily growing.

Amazon operates the world’s No. 1 e-commerce business and the world’s No. 1 cloud computing business. It also has many other businesses, notably its Fresh and Amazon Prime Now (Whole Foods) grocery delivery operations.

Meta Platforms operates the world’s leading social media site, Facebook, as well as Instagram, Threads, and messaging app WhatsApp.

Microsoft’s Word has long been the world’s leading word processing software. Word is part of Microsoft Office, a suite of popular software for personal computers (PCs). Its Azure is the world’s second-largest cloud computing business.

Tesla remains the No. 1 electric vehicle (EV) maker, by far, in the U.S. despite struggling recently. In the first half of 2025, China’s BYD surpassed Tesla as the world’s leader in all-electric vehicles by number of units sold. CEO Elon Musk touts that the company’s robotaxi and Optimus humanoid robot businesses will eventually be larger than its EV sales business.

In short, the Roundhill Magnificent Seven ETF is poised to continue to benefit from the growth of artificial intelligence. Technically, it doesn’t have a long-term history. But if it had existed many years ago, it’s easy to tell that its long-term performance would be very strong because the long-term performances of all its holdings have been anywhere from great to spectacular.

Beth McKenna has positions in Nvidia. The Motley Fool has positions in and recommends Alphabet, Amazon, Apple, Meta Platforms, Microsoft, Nvidia, and Tesla. The Motley Fool recommends BYD Company and recommends the following options: long January 2026 $395 calls on Microsoft and short January 2026 $405 calls on Microsoft. The Motley Fool has a disclosure policy.
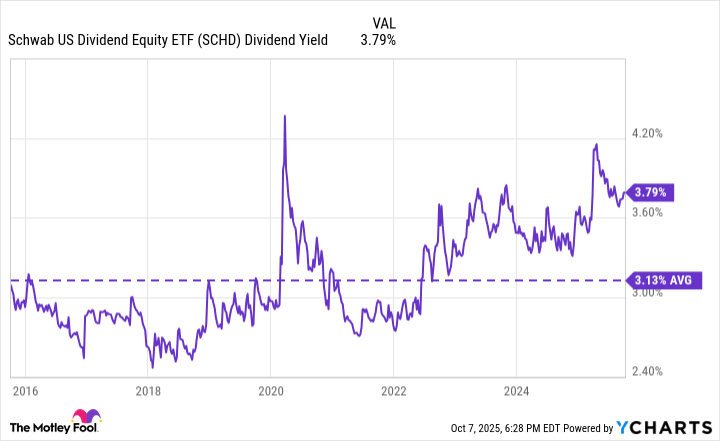
Source link

If You’d Invested $1,000 in the Vanguard S&P 500 ETF (VOO) 10 Years Ago, Here’s How Much You’d Have Today

The S&P 500 has produced historically strong returns over the past decade.

It has been a remarkably strong decade for the S&P 500. In fact, a $1,000 investment in the low-cost Vanguard S&P 500 ETF (VOO -0.35%) a decade ago would be worth about $4,100 today, assuming you reinvested all of your dividends. That is an annualized return of about 15%.

Why has the S&P 500 had such a strong decade?

It’s worth noting that a decade ago, the S&P 500 had already more than tripled from the 2009 financial crisis lows. So, adding a 310% total return on top of that is no small feat.

VOO Total Return Price Chart

VOO Total Return Price data by YCharts

The short explanation is that while most sectors have performed quite well, the bulk of the stellar performance has been largely fueled by large-cap technology stocks. After all, the trillion-dollar megacap tech stock wasn’t a thing back then, and now there are eight of them. To illustrate this, consider the five largest holdings of the Vanguard S&P 500 ETF and how each one has performed over the past decade:

Company (Symbol)

% of S&P 500

10-Year Total Return

Nvidia

8.1%

32,230%

Microsoft

7.4%

1,270%

Apple

5.8%

843%

Amazon

4.1%

802%

Alphabet

3.7%

566%

S&P 500

100%

310%

Data source: yCharts, Vanguard. Percentages of assets as of 7/31/2025.

Think about this. The worst performer of the five largest megacap tech stocks in the S&P 500 outperformed the overall index by more than 250 percentage points over the past decade.

A person on a couch with money falling all around them.

Image source: Getty Images.

Historically, the S&P 500 has delivered annualized returns in the 9% to 10% range over long periods, so it’s fair to say that this has been an incredibly strong decade for S&P 500 investors. And while there’s no way to predict what might happen over the next 10 years, it wouldn’t be realistic to expect 15% annualized returns over the long run forever.

Matt Frankel has positions in Amazon and Vanguard S&P 500 ETF. The Motley Fool has positions in and recommends Alphabet, Amazon, Apple, Microsoft, Nvidia, and Vanguard S&P 500 ETF. The Motley Fool recommends the following options: long January 2026 $395 calls on Microsoft and short January 2026 $405 calls on Microsoft. The Motley Fool has a disclosure policy.

Source link