Remember when National League pitchers batted and Clayton Kershaw seemed like an automatic out?
Your memory serves correctly: The Dodgers star left-hander batted an anemic .162 over 847 plate appearances during 13 seasons before MLB mercifully took the bat out of his — and all other pitchers — hands after the 2021 season.
Well, experts considered most adept at running the numbers calculate the likelihood of the Dodgers winning the World Series this October roughly equal to that of Kershaw getting a hit when he used to bat.
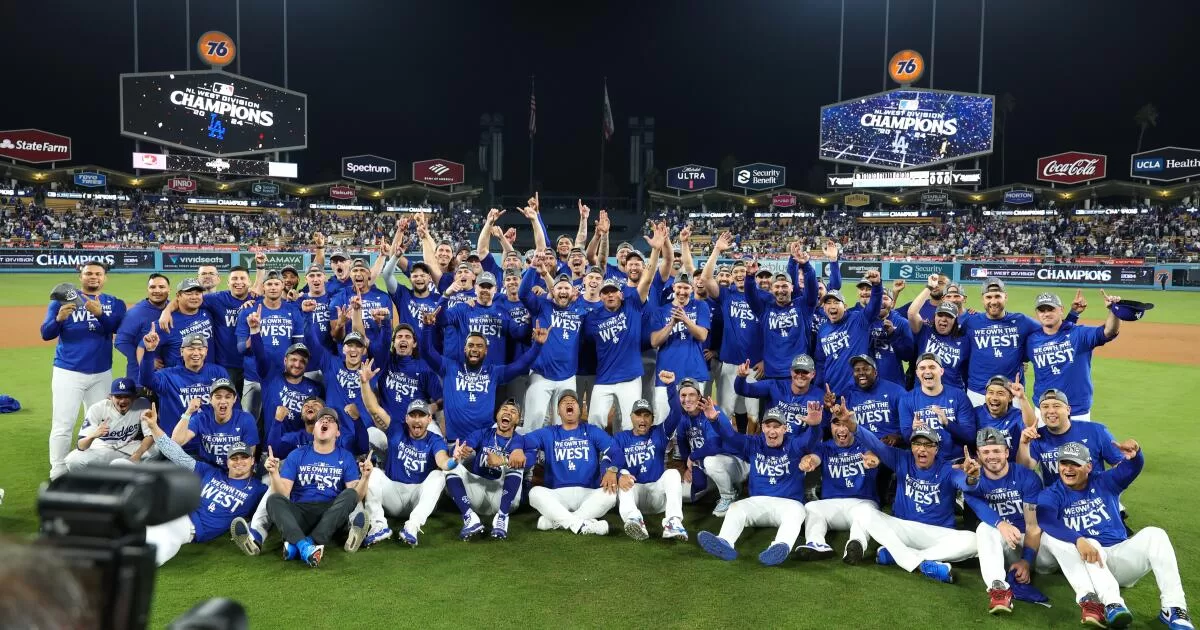
Never mind that the Dodgers (98-64) posted the best regular-season record in baseball for the third time in five seasons. Or that they won the NL West for the 11th time in 12 seasons. Or that they earned home-field advantage all the way through the World Series.
The daunting odds have little to do with the Dodgers’ patchwork starting rotation, injury to Freddie Freeman or recent history of folding early in the postseason. In a respectful nod to the delightfully unforeseen vagaries of October baseball, no team is considered even a 1-in-5 shot at being crowned World Series champion.
The Dodgers are given a 17.7% chance of a title by Baseball Prospectus, a 16.3% chance by FanGraphs and a 12% chance by Baseball Reference. That’s all, folks.
Yet those numbers are robust compared to much of their playoff competition. The American League East champion New York Yankees and and the NL East champion Philadelphia Phillies join the Dodgers as something of tri-favorites.
Then there is a steep drop, with the AL West champion Houston Astros and the AL Central champion Cleveland Guardians and the NL Central champion Milwaukee Brewers ranging from a high of 12.8% to a low of 2.5%, depending on the website.
The top wild-card teams are the San Diego Padres and the Baltimore Orioles, but neither is given even a 1-in-10 shot at winning it all. The chances of the other wild-card teams (Kansas City Royals and Detroit Tigers) winning are considered minuscule — although it’s worth noting that the odds of the Texas Rangers and Arizona Diamondbacks meeting in last year’s World Series were less than 1%.
So, how exactly do the experts come up with these projections? Explanations are provided on their sites (Hint: playoff scenarios are run through thousands of computerized simulations):
FanGraphs
To generate the playoff odds, we take the current standings, the remaining schedule, and each team’s projected performance. We use those inputs to simulate the remaining season 20,000 times. We aggregate these outcomes to find the probability of winning the division or a wild card spot, along with winning the World Series.
Baseball Prospectus
If you rub a crystal ball it will show you the future. If the ball is cracked you might cut yourself. Injury is more likely than insight. … Still, it is time for the annual feasting on the expectations of our projection system with the PECOTA standings. (PECOTA stands for Player Empirical Comparison and Optimization Test Algorithm, Baseball Prospectus’ proprietary system that projects player and team performance.)
Baseball-Reference
To compute these odds, we simulate the rest of the season and the postseason 1,000 times each day. The methodology relies on Baseball-Reference’s Simple Rating System, which provides a strength-of-schedule-adjusted rating of each team, expressed in runs per game better or worse than an average team.
For the purposes of the playoff odds simulation, we are calculating a value of SRS using each team’s previous 100 games, adding in 50 games of .500 ball for regression to the mean.
