Advertisement 8
Article content
- Mine Life Extended to the End of 2032 with 36% Increase in Total Silver Equivalent Production
- Strong Free Cash Flows Throughout the Updated Life of Mine
- Numerous Opportunities Available for Further Growth, Mine Life Extension and Margin Improvement
VANCOUVER, British Columbia, Sept. 25, 2024 (GLOBE NEWSWIRE) — Gatos Silver, Inc. (NYSE/TSX: GATO) (“Gatos Silver” or the “Company”) today reported an updated life of mine plan (the “2024 LOM Plan”) that adds two years of additional reserves and a 36% increase in silver equivalent production compared with the prior LOM plan at the Cerro Los Gatos Mine (“CLG”) in Mexico.
Article content
Gatos Silver also disclosed an updated mineral reserve estimate (the “2024 Mineral Reserve”) and mineral resource estimate (the “2024 Mineral Resource”) (and together with the 2024 LOM Plan, the “2024 Updates”) with an effective date of July 1, 2024.
The Company has a 70% interest in the Los Gatos Joint Venture (“LGJV”), which in turn owns the CLG mine. The Company has agreed to be acquired by First Majestic Silver Corp. (“First Majestic”) subject to certain conditions, including approvals of the shareholders of Gatos Silver and First Majestic. All dollar amounts are expressed in, and references to “$” refer to, United States dollars unless otherwise noted.
Dale Andres, CEO of Gatos Silver, said: “We continue to deliver on CLG’s growth potential through disciplined optimization of our assets and successful near-mine resource expansion and conversion. The 2024 LOM Plan represents our second consecutive multi-year mine life extension with the current mine life now extended to the end of 2032 in conjunction with higher mill throughput rates, which are now expected to exceed design capacity by 40% starting in mid-2025.”
Article content
“The 2024 LOM Plan shows strong cash flows and attractive all-in-sustaining costs that demonstrate why CLG is one of the highest-quality primary silver operations. Together with ongoing exploration drilling, the results of the 2024 Updates illustrate the long-term potential at CLG and why it is expected to become a cornerstone district of the First Majestic portfolio going forward.”
Summary
- Robust 2024 LOM Plan at CLG with strong annual cash flow profile (100% LGJV basis):
- Mine life extended to the end of 2032, an addition of two years at higher throughput rates of 3,500 tonnes per day
- Low by-product all-in sustaining cost (“AISC”)1,2 of $6.29 per ounce of payable silver, and co-product AISC1,2 of $14.89 per ounce of payable silver equivalent
- Average annual after-tax free cash flow2,3 of $80 million, resulting in an after-tax net present value (“NPV”)3 of $539 million based on 2024 reserve price assumptions at a silver price of $23/oz, and significant leverage to higher metal prices. The spot silver price on September 24, 2024 was $32.15/oz (XAG:USD)4.
- Average annual after-tax free cash flow2,5 of $111 million, resulting in an after-tax NPV5 of $760 million, at a silver price of $30/oz
- Average annual after-tax free cash flow2,5 of $136 million, resulting in an after-tax NPV5 of $935 million, at a silver price of $35/oz
- Total silver equivalent production6 over the LOM expected to increase by 36% and total silver production expected to increase by 22%
- Average annual production of 7.0 million ounces of silver and 14.0 million ounces of silver equivalent expected during the 2025 to 2027 period with further optimization potential
- Average annual production over the LOM of 6.1 million ounces of silver, 67 million pounds of zinc and 50 million pounds of lead, or 12.9 million ounces of silver equivalent production
- 2024 Mineral Reserve of 10.3 million tonnes at 172 g/t silver, 3.89% zinc, 2.07% lead, 0.22 g/t gold and 0.21% copper, with 57.3 million ounces of contained silver, up 28% from 8.1 million tonnes a year earlier7. For all of the mine’s five payable metals (silver, zinc, lead, gold and copper), contained metal increased even though grade was lower for all except copper.
- 2024 Mineral Resource includes 0.8 million tonnes of measured and indicated resource, up 98% from 0.4 million tonnes a year earlier and 1.51 million tonnes of inferred resource, down 67% from 4.58 million tonnes a year earlier7, reflecting successful resource to reserve conversion
- Numerous opportunities to extend mine life and further increase margins at CLG:
- Drilling continues to expand the SE Deeps zone beyond the 2024 Mineral Reserve and Mineral Resource estimates, as described in our news release dated July 23, 2024
- Two drill rigs currently drilling the Central Deeps target below the current Central and North-west zones
- Drilling of near-mine and district exploration targets increased in Q2 2024 with initial results at San Luis and Portigueño targets showing mineralization, as described in our news release dated July 23, 2024, and with follow-up drilling continuing
- Several capital efficient margin improvement projects being studied, including metallurgical recovery optimization through ultra fines recovery and potential mill throughput growth up to 4,000 tpd
Article content
2024 CLG LOM Plan Update Summary
Table 1 presents a comparison of key metrics of the 2024 LOM Plan to the previous life of mine plan announced on September 6, 2023, (the “2023 LOM Plan”) considering the comparable periods from July 1, 2024 onwards (the effective date of the 2024 LOM Plan).
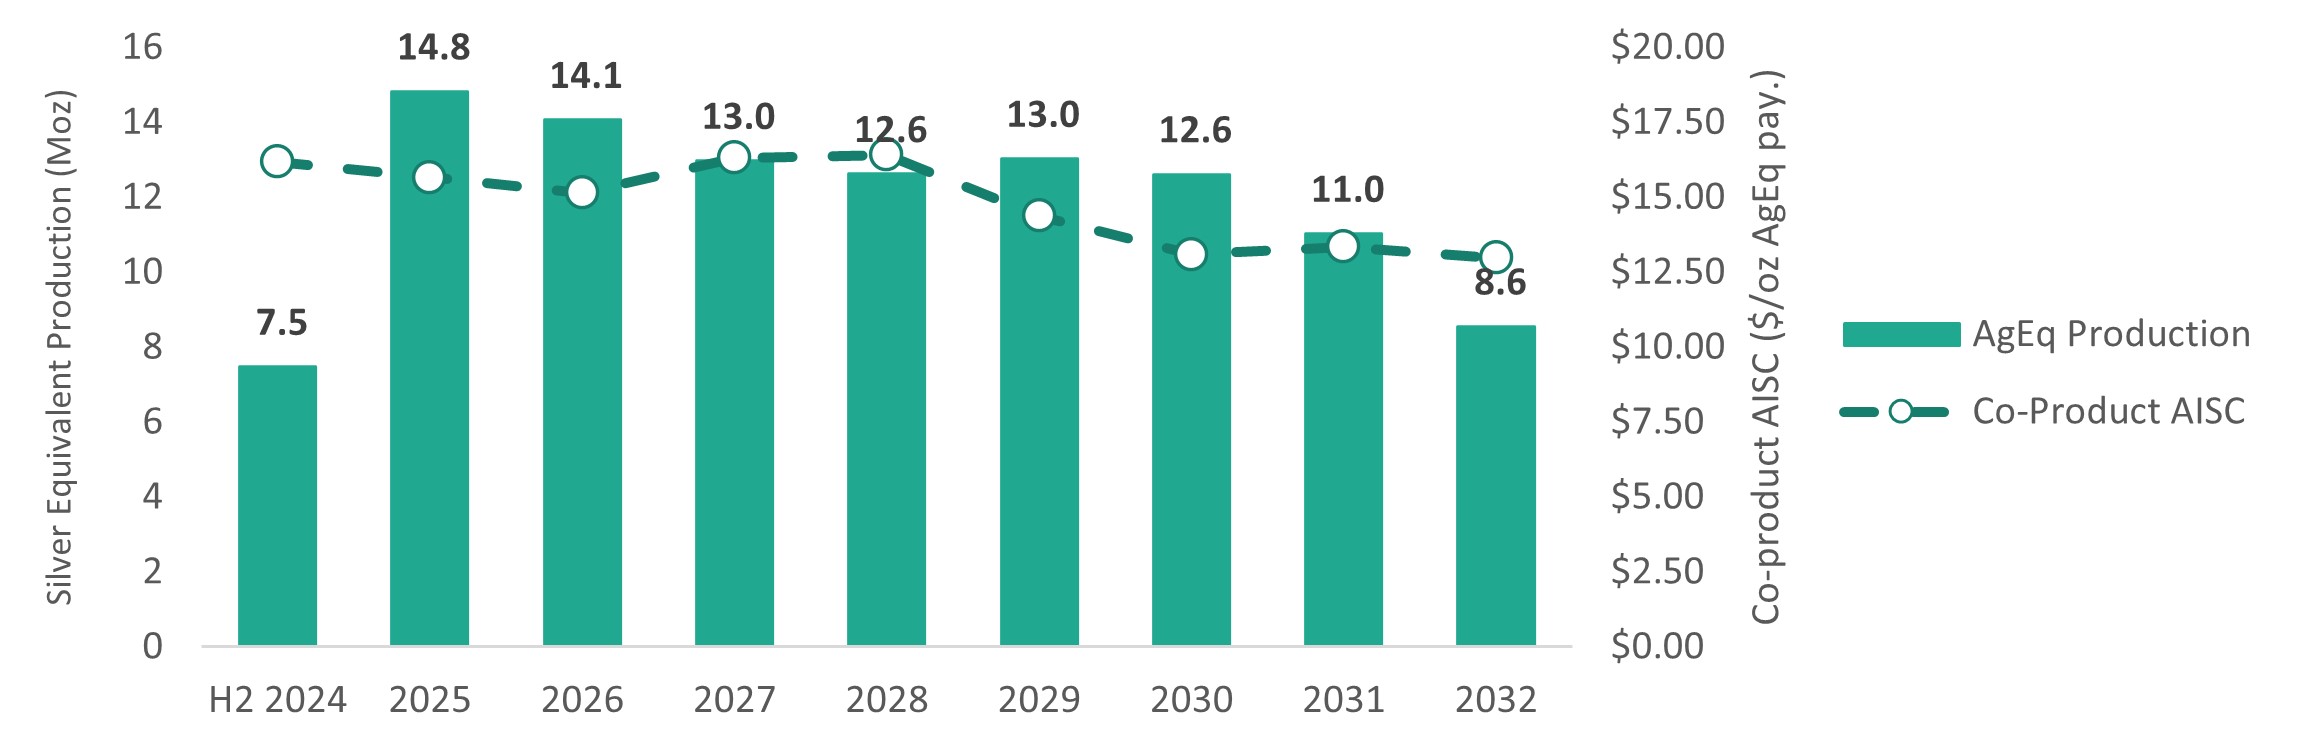
On this basis, total estimated silver equivalent production in the 2024 LOM Plan has increased by 36% compared with the 2023 LOM Plan, with lower unit operating costs resulting primarily from higher mill throughput rates which increase to a steady state of approximately 3,500 tpd by mid-2025. Total tonnes processed increased by 47% to 10.33 million tonnes. Sustaining capital increases by 63% reflecting additional underground development and infrastructure required to mine the additional tonnage. Silver equivalent production averages 12.9 million ounces per year over the mine life, and averages 14.0 million ounces during the 2025 to 2027 period. Figures 1, 2, 3 and 4 present annual and cumulative free cash flows, mill throughput rates and silver head grades, silver production and by-product AISC, and silver equivalent production and co-product AISC, respectively.
Article content
Table 1 – Summary of the 2024 LOM Plan and Comparison to the 2023 LOM Plan (100% LGJV Basis)(1,2,3)
| LOM Plan comparisons are presented from July 1, 2024 through to end of respective mine lives | 2024 LOM Plan (H2’24+) |
2023 LOM Plan (H2’24+) |
Change | Change (%) | |
| End of Mine Life | Oct. 31, 2032 | Dec. 31, 2030 | |||
| Total Tonnes Processed (Mt) | 10.33 | 7.01 | 3.33 | 47% | |
| Average Mill Throughput Rate (tpd) | 3,401 | 2,951 | 450 | 15% | |
| Total Silver Production (Moz) | 50.5 | 41.3 | 9.1 | 22% | |
| Total Silver Equivalent Production (Moz)(1) | 107.2 | 78.6 | 28.5 | 36% | |
| Average Silver Production (Moz / year)(2) | 6.1 | 6.4 | (0.3) | (5)% | |
| Average Zinc Production (Mlbs / year)(2) | 67.2 | 63.7 | 3.5 | 5% | |
| Average Lead Production (Mlbs / year)(2) | 50.0 | 46.8 | 3.2 | 7% | |
| Average Silver Equivalent Production (Moz / year)(1) | 12.9 | 12.1 | 0.8 | 6% | |
| Site Operating Costs ($/tonne milled) | $82.14 | $87.72 | ($5.58) | (6)% | |
| Sustaining Capital ($M) | $186.9 | $114.7 | $72.19 | 63% | |
| By-Product AISC ($/oz Ag pay.)(3) | $6.29 | $7.22 | ($0.94) | (13)% | |
| Co-Product AISC ($/oz AgEq pay.)(3) | $14.89 | $14.17 | $0.72 | 5% | |
(1) Silver equivalent production for the 2024 LOM Plan is calculated using 2024 reserve price assumptions to “convert” zinc, lead, gold and copper production contained in concentrates to “equivalent” silver ounces (contained metal, multiplied by price, divided by silver price). Silver equivalent production for the 2024 LOM Plan uses 2024 reserve price assumptions of $23/oz silver, $1.25/lb zinc, $0.95/lb lead, $1,850/oz gold and $4.00/lb copper. Silver equivalent production for the 2023 LOM Plan did not include copper due to relatively low payable quantities, and used prices of $22/oz silver, $1.20/lb zinc, $0.90/lb lead, $1,700/oz gold, $3.50/lb copper.
(2) Silver production is silver contained in Pb, Zn and Cu concentrates, zinc production is zinc contained in Zn concentrate, lead production is lead contained in Pb concentrate.
(3) By-product AISC and Co-product AISC include the LGJV management fee and administrative costs of $1.35 / oz Ag payable and $0.65 / oz AgEq payable, respectively in the 2024 LOM Plan and $1.13 / oz Ag payable and $0.60 / oz AgEq payable, respectively in the 2023 LOM Plan from July 1, 2024. Refer to Table 9 for AISC details.
Article content
Figure 1 – 2024 LOM Annual Free Cash Flow (100% LGJV Basis)
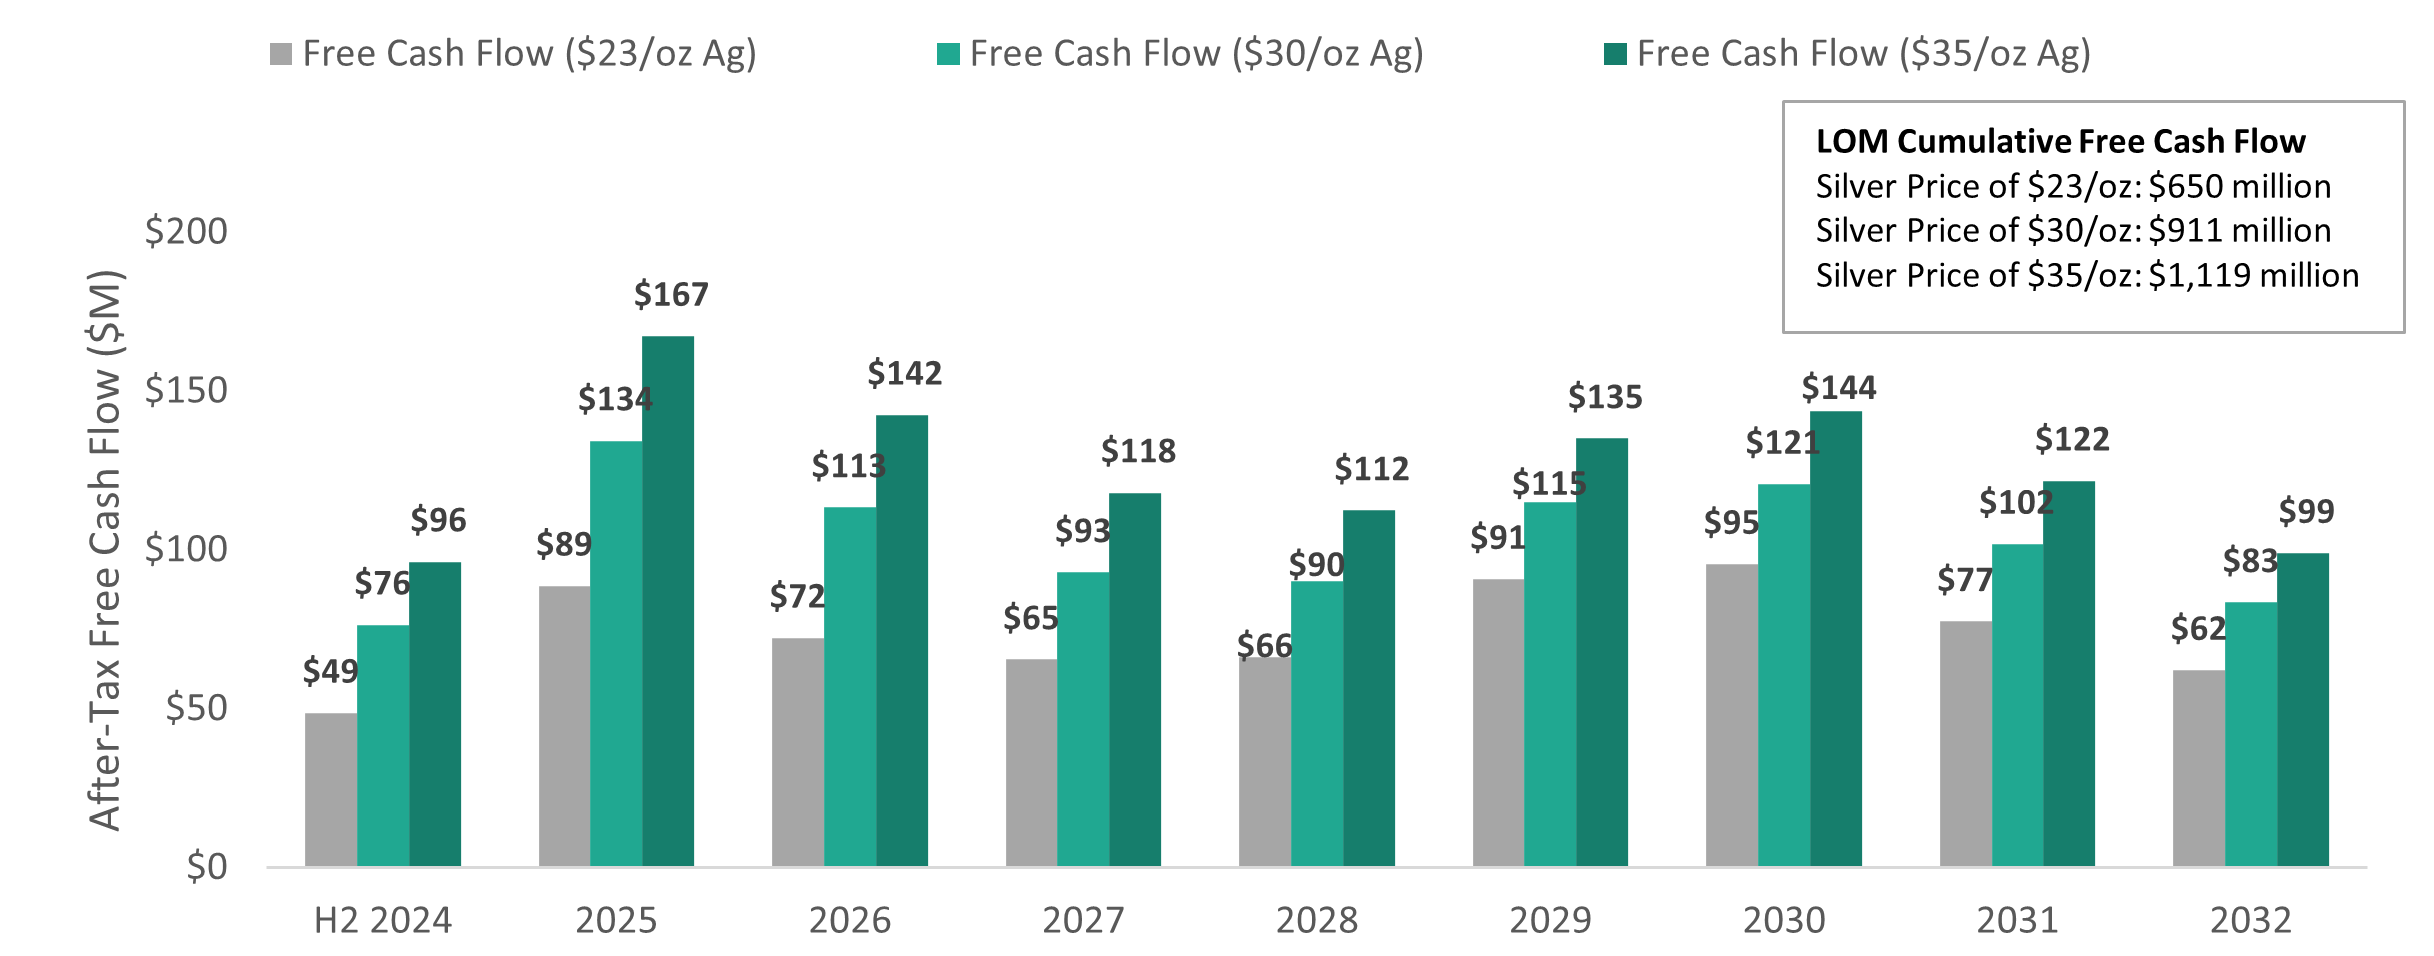
Figure 2 – LOM Mill Throughput and Silver Grade (2024 LOM Plan and 2023 LOM Plan)
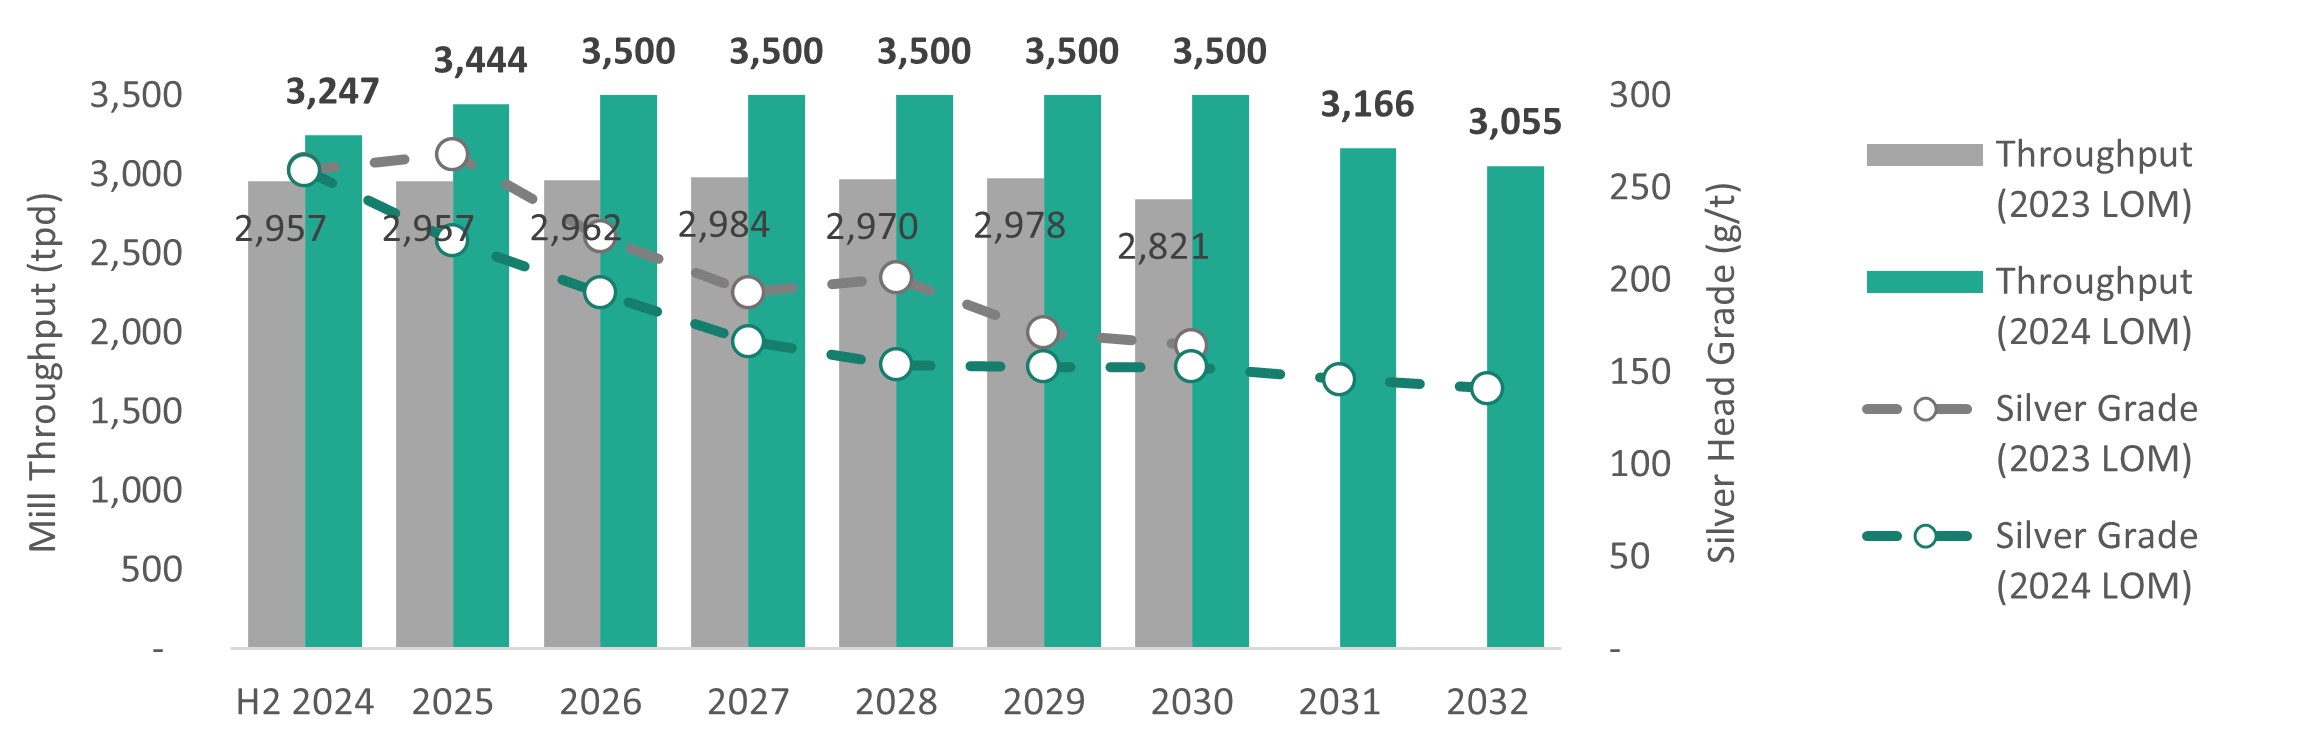
Figure 3 – 2024 LOM Silver Production and By-Product AISC (100% LGJV Basis)

Figure 4 – 2024 LOM Silver Equivalent Production and Co-Product AISC (100% LGJV Basis)
2024 CLG Mineral Reserve and Mineral Resource Tables
The 2024 Mineral Reserve for CLG by reserve category is summarized in Table 2 and the 2024 Mineral Resource for CLG reported by category is summarized in Table 3.
Table 2: 2024 CLG Mineral Reserve as at July 1, 2024 (1,2,3,4,5,6,7,8,9,10)
| 100% LGJV Basis | Mt | Ag (g/t) |
Zn (%) |
Pb (%) |
Au (g/t) |
Cu (%) |
Ag (Moz) |
Zn (Mlbs) |
Pb (Mlbs) |
Au (koz) |
Cu (Mlbs) |
| Proven | 3.49 | 300 | 4.35 | 2.09 | 0.29 | 0.09 | 33.6 | 334.4 | 160.6 | 32.6 | 7.0 |
| Probable | 6.85 | 107 | 3.66 | 2.06 | 0.18 | 0.26 | 23.6 | 552.3 | 310.9 | 40.5 | 40.0 |
| Proven and Probable | 10.33 | 172 | 3.89 | 2.07 | 0.22 | 0.21 | 57.3 | 886.7 | 471.4 | 73.1 | 46.9 |
| 70% GSI Attributable Basis | Mt | Ag (g/t) |
Zn (%) |
Pb (%) |
Au (g/t) |
Cu (%) |
Ag (Moz) |
Zn (Mlbs) |
Pb (Mlbs) |
Au (koz) |
Cu (Mlbs) |
| Proven | 2.44 | 300 | 4.35 | 2.09 | 0.29 | 0.09 | 23.5 | 234.1 | 112.4 | 22.8 | 4.9 |
| Probable | 4.80 | 107 | 3.66 | 2.06 | 0.18 | 0.26 | 16.5 | 386.6 | 217.6 | 28.4 | 28.0 |
| Proven and Probable | 7.23 | 172 | 3.89 | 2.07 | 0.22 | 0.21 | 40.1 | 620.7 | 330.0 | 51.2 | 32.8 |
Article content
(1) Mineral Reserves are reported on a 100% LGJV basis and 70% GSI attributable basis and exclude all Mineral Reserve material mined prior to July 1, 2024.
(2) Specific gravity has been assumed on a dry basis.
(3) Tonnage and contained metal have been rounded to reflect the accuracy of the estimate and numbers may not sum exactly.
(4) Values are inclusive of mining recovery and dilution. Values are determined as of delivery to the mill (point of reference) and therefore not inclusive of milling recoveries.
(5) Mineral Reserves are reported within stope shapes using a variable cut-off basis with a Ag price of US$23/oz, Zn price of US$1.25/lb, Pb price of US$0.95/lb, Au price of US$1,850/oz and Cu price of $4.00/lb. Metallurgical recoveries used in the NSR calculation for generation of the stope solids vary based on the block Pb:Cu ratio. For a Pb:Cu ratio >15 the NSR metallurgical recovery parameters were 88.2% Ag, 63.4% Zn, 89.4% Pb, 54.2% Au and 0% Cu, for Pb:Cu of >7 and <15 , 54.2% 60% 63.1% 63.4% 71.5% 82% 87.2% 88.2% 88.5% 89.4% <7 after ag, analysis, and au average concentrates cu cu. economic for in metal metallurgical modelling, nsr of parameters payable.< pb, pb:cu plant production ratio recovery sup the to used were where zn,>
(6) The Mineral Reserve is reported on a fully diluted basis defined by mining method, stope geometry and ground conditions.
(7) Contained Metal (CM) is calculated as follows:
Article content
- Zn, Pb and Cu, CM (Mlb) = Tonnage (Mt) * Grade (%) / 100 * 2204.6
- Ag and Au, CM (Moz) = Tonnage (Mt) * Grade (g/t) / 31.1035 ; multiply Au CM (Moz) by 1000 to obtain Au CM (koz)
(8) Under SEC Regulation S-K 1300, a Mineral Reserve is an estimate of tonnage and grade or quality of indicated and measured mineral resources that, in the opinion of the qualified person, can be the basis of an economically viable project. More specifically, it is the economically mineable part of a measured or indicated mineral resource, which includes diluting materials and allowances for losses that may occur when the material is mined or extracted.
(9) The SEC definitions for Mineral Reserves in Regulation S-K 1300 were used for Mineral Reserve classification and are consistent with Canadian Institute of Mining, Metallurgy and Petroleum (CIM) Definition Standards for Mineral Resources and Mineral Reserves (CIM (2014) definitions).
(10) The Mineral Reserve estimates were prepared under the supervision of Mr. Stephan Blaho, P.Eng. an employee of WSP Canada Inc. who is the independent Qualified Person for these Mineral Reserve estimates.
Advertisement 9
Article content
Table 3: 2024 CLG Mineral Resource
as at July 1, 2024 (Exclusive of Mineral Reserves) (1,2,3,4,5,6,7,8,9,10,11)
| 100% LGJV Basis | Mt | Ag (g/t) |
Zn (%) |
Pb (%) |
Au (g/t) |
Cu (%) |
Ag (Moz) |
Zn (Mlbs) |
Pb (Mlbs) |
Au (koz) |
Cu (Mlbs) |
|||||||||||||||||||||
| Measured | 0.24 | 222 | 2.78 | 1.51 | 0.36 | 0.07 | 1.7 | 14.7 | 8.0 | 2.8 | 0.3 | |||||||||||||||||||||
| Indicated | 0.55 | 75 | 3.71 | 2.00 | 0.21 | 0.25 | 1.3 | 44.8 | 24.1 | 3.7 | 3.1 | |||||||||||||||||||||
| Measured and Indicated | 0.79 | 120 | 3.43 | 1.85 | 0.26 | 0.20 | 3.0 | 59.5 | 32.0 | 6.5 | 3.4 | |||||||||||||||||||||
| Inferred | 1.51 | 80 | 4.22 | 2.01 | 0.22 | 0.29 | 3.9 | 140.2 | 66.9 | 10.5 | 9.5 | |||||||||||||||||||||
| |
||||||||||||||||||||||||||||||||
| 70% GSI Attributable Basis | Mt | Ag (g/t) |
Zn (%) |
Pb (%) |
Au (g/t) |
Cu (%) |
Ag (Moz) |
Zn (Mlbs) |
Pb (Mlbs) |
Au (koz) |
Cu (Mlbs) |
|||||||||||||||||||||
| Measured | 0.17 | 222 | 2.78 | 1.51 | 0.36 | 0.07 | 1.2 | 10.3 | 5.6 | 2.0 | 0.2 | |||||||||||||||||||||
| Indicated | 0.38 | 75 | 3.71 | 2.00 | 0.21 | 0.25 | 0.9 | 31.4 | 16.9 | 2.6 | 2.1 | |||||||||||||||||||||
| Measured and Indicated | 0.55 | 120 | 3.43 | 1.85 | 0.26 | 0.20 | 2.1 | 41.6 | 22.4 | 4.6 | 2.4 | |||||||||||||||||||||
| Inferred | 1.06 | 80 | 4.22 | 2.01 | 0.22 | 0.29 | 2.7 | 98.2 | 46.8 | 7.4 | 6.7 | |||||||||||||||||||||
(1) Mineral Resources are reported on a 100% LGJV basis and 70% GSI attributable basis and are exclusive of Mineral Reserves.
(2) Under SEC Regulation S-K 1300, a Mineral resource is a concentration or occurrence of material of economic interest in or on the Earth’s crust in such form, grade or quality, and quantity that there are reasonable prospects for economic extraction. A mineral resource is a reasonable estimate of mineralization, taking into account relevant factors such as cut-off grade, likely mining dimensions, location or continuity, that, with the assumed and justifiable technical and economic conditions, is likely to, in whole or in part, become economically extractable. It is not merely an inventory of all mineralization drilled or sampled. Mineral Resources which are not Mineral Reserves do not have demonstrated economic viability. The estimate of Mineral Resources may be materially affected by environmental, permitting, legal, marketing, or other relevant issues.
(3) The SEC definitions for Mineral Resources in S-K 1300 were used for Mineral Resource classification which are consistent with Canadian Institute of Mining, Metallurgy and Petroleum (CIM) Definition Standards for Mineral Resources and Mineral Reserves (CIM (2014) definitions).
(4) The quantity and grade of reported Inferred Mineral Resources in this estimation are uncertain in nature and there has been insufficient exploration to define these Inferred Mineral Resources as an Indicated or Measured Mineral Resource. It is uncertain if further exploration will result in upgrading Inferred Mineral Resources to an Indicated or Measured Mineral Resource category.
(5) Specific gravity has been assumed on a dry basis.
(6) Tonnage and contained metal have been rounded to reflect the accuracy of the estimate and numbers may not sum exactly.
(7) Mineral Resources exclude all Mineral Resource material mined prior to July 1, 2024.
(8) Mineral Resources are reported within stope shapes using a $70.94/tonne net smelter return (“NSR”) cut-off calculated using an Ag price of US$23/oz, Zn price of US$1.25/lb, Pb price of US$0.95/lb, Au price of US$1,850/oz and Cu price of $4.00/lb. The NSR cutoff includes mill recoveries and payable metal factors appropriate to the existing CLG processing circuit augmented with a pyrite leach circuit and copper separation circuit. The milling recoveries for these additional projects is based on existing metallurgical testwork. The metallurgical recoveries that are used as inputs to the resource NSR are 93.2% Ag, 63.4% Zn, 61.1% Au and range between 87.2%-89.4% Pb and between 66.5%-82.0% Cu.
(9) No dilution was applied to the Mineral Resource which are reported on an insitu basis (point of reference).
(10) Contained Metal (CM) is calculated as follows:
Advertisement 10
Article content
- Zn, Pb and Cu CM (Mlb) = Tonnage (Mt) * Grade (%) / 100 * 2204.6
- Ag and Au, CM (Moz) = Tonnage (Mt) * Grade (g/t) / 31.1035 ; multiply Au CM (Moz) by 1000 to obtain Au CM (koz)
(11) The Mineral Resource estimates were prepared under the supervision of Ronald Turner, MAusIMM(CP) an employee of Golder Associates S.A. who is the independent Qualified Person for these Mineral Resource estimates.
Diamond Drilling
The increases in mineral reserve and mineral resource are primarily driven by extensive diamond drilling completed between the 2023 and 2024 updates. The 2024 Mineral Resource update for CLG used a total of 1,666 diamond drill holes totaling 346,639 metres. Between the updates, data from 53,689 metres of surface resource drilling from 75 holes and 12,354 metres of underground definition drilling from 118 holes was added to the database; these new drillholes are shown in Figure 5 below. The data cut-off date used for the 2024 Updates was March 31, 2024.
Various control measures are in place at CLG to ensure reliable drilling data for estimation, including a secure database system, quality assurance and quality control measures and periodic reporting and gyro downhole surveying for surface drill holes.
Advertisement 11
Article content
Figure 5 – New Drilling Added between 2023 and 2024 Mineral Reserve and Mineral Resource Updates

Mineral Resource Estimation
The 2024 Mineral Resource uses an estimation methodology that is similar to the methodology used for the 2023 mineral resource estimate. Geological interpretation of 3D domain solids was completed using all available information including detailed underground mapping, channel sampling and surface and underground diamond drilling. The block model estimation uses assay information from diamond drill core only. The model interpolation is by multiple pass ordinary kriging using locally varying anisotropy to follow the changes in dip and azimuth of the veins. Control of outlier grades is by traditional top cutting. The limits set for the top cut were based on statistical analysis and comparison of mined areas to actual production. CLG mineral resources are reported exclusive of mineral reserves and within stope shapes to define reasonable prospects of economic extraction.
Changes from 2023 are the change from high grade restriction to top cutting and the removal of the fourth estimation pass with longer ranges that was previously used for inferred resource only.
Advertisement 12
Article content
2024 Mine Design and Scheduling
The methodology used to prepare the 2024 mine design is similar to the methodology that was implemented for the 2023 updates, with updates to account for changes in actual operating performance.
Long-hole (“LH”) mining methods were applied where amenable throughout the mine which represents approximately 73% of total LOM stope production. Stope production in the mine plan varies between approximately 55% to 80% LH in 2025-2028, increasing to greater than 90% LH towards the end of the mine life. Areas that are not amenable to LH mining are planned to be extracted using cut and fill (“C+F”) methods. See Figure 6 below for a comparison of the 2024 mine design versus the 2023 mine design.
Mineral reserve stopes are planned to be filled using primarily paste fill, with uncemented rock fill and, to a lesser extent cemented rock fill, also considered in certain stopes and areas.
Mine dilution and mine recovery estimates are based on recent actual operating performance. These assumptions are applied based on the mining method, stope width, zone inclination and proximity to hanging-wall faults.
Advertisement 13
Article content
Operating and sustaining capital cost assumptions are based on recent actual costs with minor allowances for business improvement initiatives that are defined and being implemented. Mine operating costs were developed separately for LH and C+F mining methods.
Figure 6 – Long Section of CLG 2024 and 2023 Mineral Reserve Solids

2024 LOM Production Plan
The 2024 LOM Plan is based on a steady-state processing rate of 3,500 tonnes per day from mid-2025 onwards, resulting in a mine plan that exhausts current mineral reserves in Q4 2032. Steady-state LOM mining rates are approximately 8% higher than current operating rates and are projected to steadily increase through the end of 2024 and first half of 2025. Underground development for mining the 2024 Mineral Reserve is expected to be materially complete by 2030.
Mineral processing at the current operation uses conventional sulphide flotation, producing separate lead and zinc concentrates. The 2024 LOM considers the installation of a copper-lead separation circuit to produce a separate copper concentrate from higher copper mill feeds, which is expected to be operational in 2026. Predicted metallurgical recoveries over the 2024 LOM Plan average 88.2%, 63.1%, 88.5%, 54.2% and 71.5% for silver, zinc, lead, gold and copper, respectively. Recoveries were estimated based on recent actual plant performance, as well as recent metallurgical test work on South-East zone copper-lead separation. A total of 107.2 million ounces of silver equivalent are estimated to be produced according to the 2024 LOM Plan, comprised of 50.5 million ounces of silver, 560 million pounds of zinc, 417 million pounds of lead, 39.6 thousand ounces of gold and 33.5 million pounds of copper.
Advertisement 14
Article content
Production and recovery numbers are calculated based on metals recovered to concentrates where the grades are expected to be in payable quantities. Silver production and recoveries are silver contained in lead, zinc and copper concentrates; zinc production and recoveries are zinc contained in zinc concentrate; lead production and recoveries are lead contained in lead concentrate; gold production and recoveries are gold contained in lead and copper concentrates; and copper production and recoveries are copper contained in lead and copper concentrates.
Table 4: Life of Mine Projected Processing and Production Summary (100% LGJV Basis)(1)
| Plant Metrics | Units | H2 2024 |
2025 | 2026 | 2027 | 2028 | 2029 | 2030 | 2031 | 2032 | LOM |
| Processed Material | Mt | 0.60 | 1.26 | 1.28 | 1.28 | 1.28 | 1.28 | 1.28 | 1.16 | 0.93 | 10.33 |
| Process Rate | tpd | 3,247 | 3,444 | 3,500 | 3,500 | 3,500 | 3,500 | 3,500 | 3,166 | 3,055 | 3,401 |
| Ag Grade | g/t | 260 | 221 | 193 | 167 | 154 | 153 | 153 | 146 | 141 | 172 |
| Zn Grade | % | 4.02 | 4.30 | 4.42 | 4.05 | 3.98 | 4.22 | 3.35 | 3.30 | 3.24 | 3.89 |
| Pb Grade | % | 1.89 | 2.04 | 2.13 | 2.10 | 2.12 | 2.13 | 1.99 | 2.05 | 2.09 | 2.07 |
| Au Grade | g/t | 0.26 | 0.23 | 0.25 | 0.20 | 0.22 | 0.24 | 0.21 | 0.19 | 0.18 | 0.22 |
| Cu Grade | % | 0.09 | 0.12 | 0.12 | 0.14 | 0.16 | 0.21 | 0.37 | 0.33 | 0.27 | 0.21 |
| Ag Production | Moz | 4.4 | 7.9 | 7.0 | 6.0 | 5.6 | 5.5 | 5.5 | 4.8 | 3.7 | 50.5 |
| Zn Production | Mlbs | 33.4 | 75.2 | 78.7 | 72.0 | 71.0 | 75.1 | 59.5 | 53.1 | 42.0 | 559.9 |
| Pb Production | Mlbs | 22.2 | 50.6 | 53.3 | 52.6 | 53.0 | 52.8 | 49.0 | 45.7 | 37.8 | 417.0 |
| Au Production | koz | 2.8 | 5.1 | 5.6 | 4.5 | 4.9 | 5.4 | 4.6 | 3.8 | 3.0 | 39.6 |
| Cu Production | Mlbs | 0.7 | 2.0 | 0.9 | 2.8 | 3.4 | 4.5 | 8.4 | 6.7 | 4.2 | 33.5 |
| AgEq Production | Moz | 7.5 | 14.8 | 14.1 | 13.0 | 12.6 | 13.0 | 12.6 | 11.0 | 8.6 | 107.2 |
Advertisement 15
Article content
(1) LOM begins on July 1, 2024. The 2024 Mineral Reserve excludes all mineral reserve material processed prior to July 1, 2024.
CLG’s short term definition drilling and short term mine plan updates required for execution may cause actual annual operating results to differ significantly from the 2024 LOM Plan schedule shown in Table 4. Gatos Silver provides annual production guidance and quarterly production results for CLG, and such results can vary quarter over quarter based on short term execution plans and constraints. The Company cautions investors that guidance might differ from the 2024 LOM Plan, and actual results might significantly differ from guidance.
2024 LOM Cash Flows
Table 5 presents a summary of 2024 LOM Plan cash flows. In the 2024 LOM Plan, silver accounts for 49% of the total payable metal value, with zinc, lead, gold and copper representing 28%, 17%, 2% and 4%, respectively.
Table 5: Summary of 2024 LOM Plan Free Cash Flow at Various Silver Prices(1,2) (100% LGJV Basis)
| After-tax Free Cash Flow ($M)(2) | H2 2024 |
2025 | 2026 | 2027 | 2028 | 2029 | 2030 | 2031 | 2032 | 2033+ | LOM | |
| Silver Price $21/oz | 40.7 | 76.5 | 64.0 | 58.2 | 59.4 | 83.8 | 88.5 | 71.7 | 57.8 | (16.4) | 584.2 | |
| 2024 Reserve Prices ($23/oz Ag) | 48.6 | 88.6 | 72.2 | 65.4 | 66.3 | 90.7 | 95.5 | 77.4 | 62.1 | (16.4) | 650.4 | |
| Silver Price $25/oz | 56.5 | 101.7 | 83.9 | 72.6 | 73.1 | 97.6 | 102.4 | 83.1 | 67.9 | (16.4) | 722.5 | |
| Silver Price $30/oz | 76.4 | 134.3 | 113.3 | 92.8 | 90.2 | 114.9 | 120.6 | 101.8 | 83.4 | (16.4) | 911.3 | |
| Silver Price $35/oz | 96.2 | 167.2 | 142.4 | 118.0 | 112.3 | 135.0 | 143.6 | 121.7 | 98.9 | (16.4) | 1,118.9 | |
Advertisement 16
Article content
(1) Prices for zinc, lead, gold and copper are maintained at 2024 reserve assumptions of $1.25/lb, $0.95/lb, $1,850/oz and $4.00/lb, respectively.
(2) See Non-GAAP Financial Measures below.
Figure 7 presents a sensitivity of 2024 LOM Plan net present value to silver prices.
Figure 7 – Summary of 2024 LOM Plan Net Present Value at Various Silver Prices(1) (100% LGJV Basis)
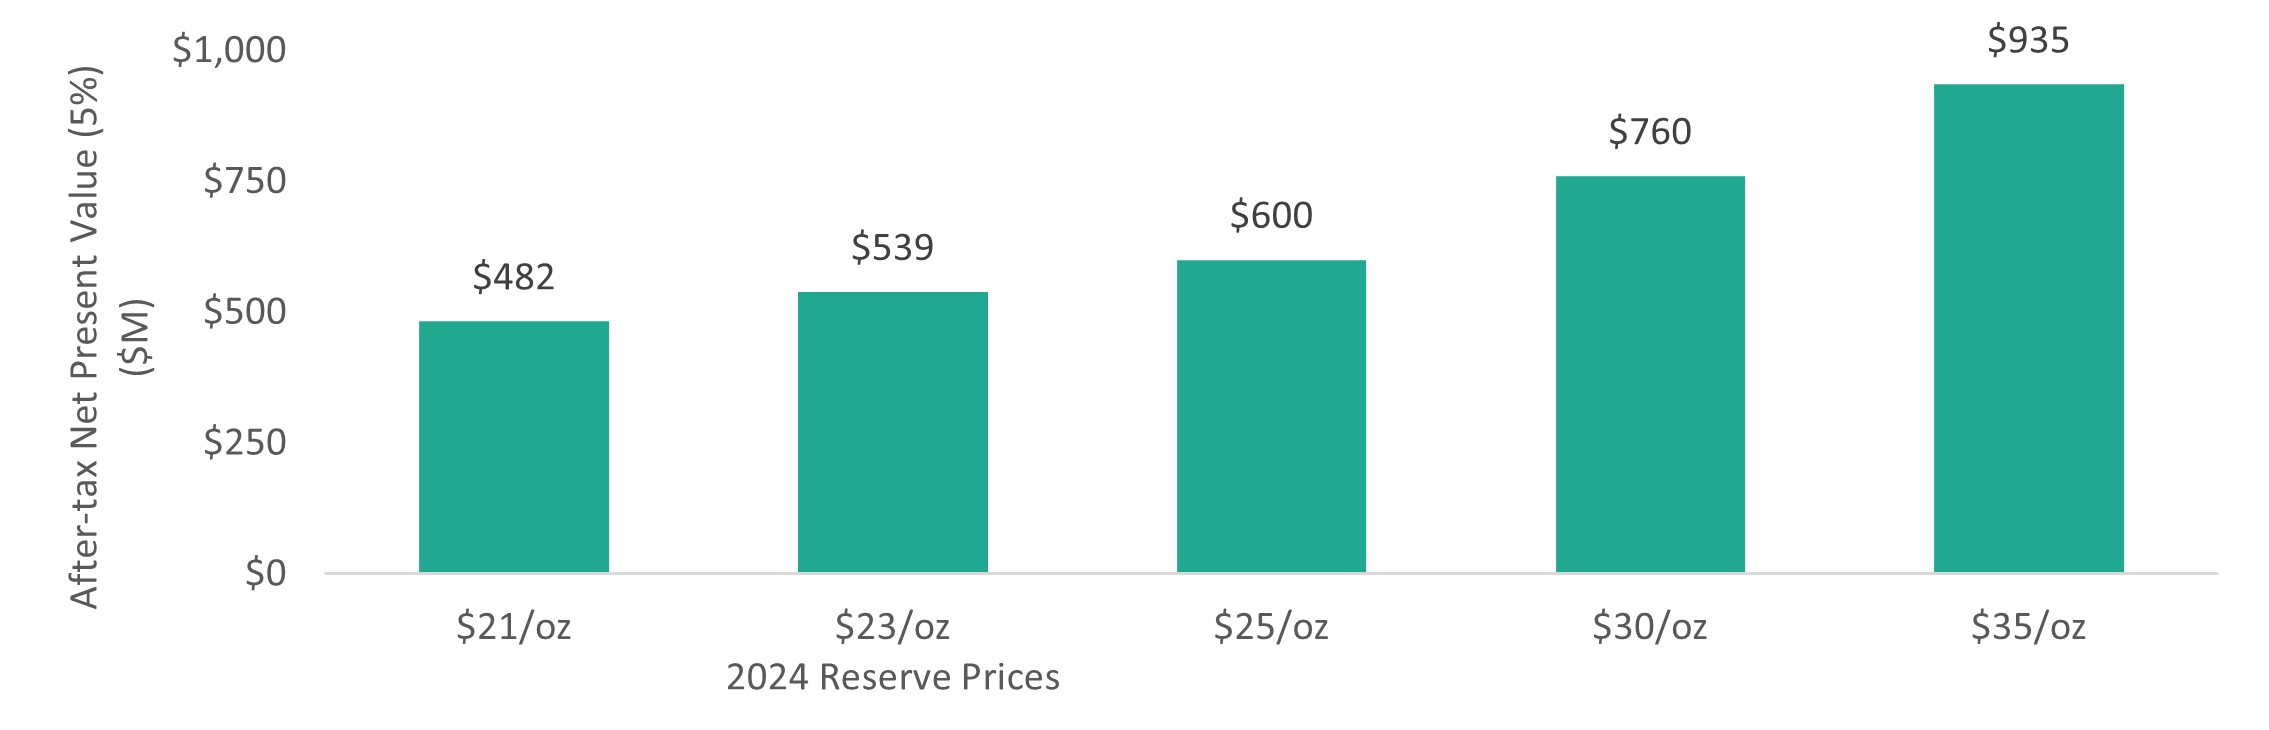
(1) NPV as of July 1, 2024 at a 5% discount rate. Prices for zinc, lead, gold and copper are maintained at 2024 reserve assumptions of $1.25/lb, $0.95/lb, $1,850/oz and $4.00/lb, respectively.
Total sustaining capital costs for the 2024 LOM Plan at CLG are estimated at $186.9 million. Sustaining capital costs are summarized in Table 6 below.
Sustaining capital costs include underground access development to the lower levels in the Central and North-West Zones, and development of the South-East Deeps zone. They also include ventilation infrastructure, together with equipment replacements and other infrastructure projects including installation of the copper-lead separation circuit, upgrades to the underground dewatering system as the mine is developed further, and two additional tailings dam raises anticipated to be completed in 2025 and 2027/2028.
Advertisement 17
Article content
Table 6: 2024 LOM Plan Sustaining Capital Costs Summary
| Sustaining Capital Costs | LOM ($M) | |
| Mine Development | $96.1 | |
| Infrastructure and Equipment | $90.8 | |
| Total Sustaining Capital Cost | $186.9 | |
The average 2024 LOM Plan site operating costs are estimated at $82.14 per tonne milled and are summarized in Table 7 below. Operating costs have been developed based on recent actual costs considering the continued ramp-up to 3,500 tpd, the transition to a higher proportion of LH stoping mining in the plan, and minor allowances for business improvement initiatives that are currently being implemented. Operating costs are based on long term assumptions, including a Mexican Peso exchange rate of MXN 20.00 per US$1.00.
Table 7: 2024 LOM Plan Unit Operating Costs Summary
| Unit Operating Costs | LOM ($/t) | |
| Mining | $42.16 | |
| Processing | $24.77 | |
| Mine General and Administrative | $15.20 | |
| Total Operating Cost | $82.14 | |
All-in sustaining costs are defined in the Non-GAAP Financial Performance Measures section and summarized in Table 8 below.
Table 8: 2024 LOM Plan All-In Sustaining Costs(1)
Advertisement 18
Article content
| Cash Costs and All-In Sustaining Costs | Units | LOM | ||
| Cash Costs | $M | $1,147.8 | ||
| Sustaining Capital | $M | $186.9 | ||
| All-In Sustaining Costs | $M | $1,334.7 | ||
| Payable Silver Ounces | Moz | 45.5 | ||
| All-In Sustaining Costs before by-product credits | $/oz Ag payable | $29.33 | ||
| By-Product Credits | $/oz Ag payable | ($24.39) | ||
| By-product All-In Sustaining Costs | $/oz Ag payable | $4.94 | ||
| Payable Silver Equivalent Ounces | Moz AgEq | 93.8 | ||
| Co-product All-In Sustaining Costs | $/oz AgEq | $14.24 | ||
(1) By-product AISC and Co-product AISC exclude the LGJV management fee and administrative costs of $1.35 / oz Ag payable and $0.65 / oz AgEq payable, respectively. Refer to Table 9 for AISC details.
Opportunities – Growth, Margin Improvement and District-Scale Potential
The LGJV is analyzing multiple value enhancement projects beyond the 2024 LOM Plan and 2024 Mineral Reserve. The CLG team is focused on continuing to gradually increase mine production rates by implementing various optimization and improvement initiatives across the maintenance and mine operation functions. Capital efficient modifications to the existing plant to increase throughput rates beyond 3,500 tpd are being evaluated. The LGJV has completed preliminary metallurgical testwork on potentially improving silver, zinc and gold recoveries through either ultra fines recovery or increasing silver and gold recovery through a pyrite recovery circuit. These processing concepts along with mill expansion projects will continue to be analyzed over the coming year in conjunction with targets to increase mineral reserves and further mine life extension initiatives, with the potential to increase throughput rates up to 4,000 tpd.
Advertisement 19
Article content
The Los Gatos District (“LGD”) is comprised of a large land package covering over 103,000 hectares with an established pipeline of prospects and more than 50 targets identified to date. Since the database cutoff on March 31, 2024, drilling at South-East Deeps has shifted back towards resource extension drilling, testing for the limits of mineralization potential along strike, down-plunge and shallower within the overall SE Deeps zone, with drilling results described in our news release dated July 23, 2024 demonstrating the extension of this mineralization beyond what formed the basis of the 2024 Updates, and continuing to highlight additional potential of the system. Following the March 31, 2024 database cutoff, the focus of exploration has shifted to explore the broader LGD, including drilling at the Portigueño, Central Deeps and San Luis targets, with early results showing mineralization as described in our news release dated July 23, 2024. Quarterly exploration program updates will continue with the next one expected in early October.
Esther Mineral Resource Unchanged since 2022
Advertisement 20
Article content
The Esther Mineral Resource was not updated during 2024 and remains the same as reported in 2022 and 2023.
Updated Technical Reports
The Company expects to file an updated technical report summary prepared in accordance with subpart 1300 of Regulation S-K (“S-K 1300”) in the United States on the EDGAR section of the Securities and Exchange Commission (“SEC”) website at www.sec.gov, and file an updated technical report prepared in accordance with National Instrument 43-101 – Standards of Disclosure for Mineral Projects (“NI 43-101”) in Canada under the Company’s profile on SEDAR+ at www.sedarplus.ca (collectively, the “2024 Technical Reports”), to support the disclosure regarding the 2024 Updates. The 2024 Technical Reports are expected to be filed within 45 days.
About Gatos Silver
Gatos Silver is a silver dominant exploration, development and production company that discovered a new silver and zinc-rich mineral district in southern Chihuahua State, Mexico. As a 70% owner of the Los Gatos Joint Venture (“LGJV”), the Company is primarily focused on operating the Cerro Los Gatos mine and on growth and development of the Los Gatos district. The LGJV includes approximately 103,000 hectares of mineral rights, representing a highly prospective and under-explored district with numerous silver-zinc-lead epithermal mineralized zones identified as priority targets.
Advertisement 21
Article content
On September 5, 2024 Gatos Silver and First Majestic Silver Corp. (“First Majestic”) announced they entered into a definitive merger agreement pursuant to which First Majestic will acquire all of the issued and outstanding common shares of Gatos Silver. The proposed transaction would consolidate three world-class, producing silver mining districts in Mexico to create a leading intermediate primary silver producer. Information relating to the proposed transaction can be found at the Company’s website at www.gatossilver.com.
Quality Assurance/Quality Control
The half core samples from the LGJV’s surface exploration drillholes are shipped directly in sealed bags to the ALS Limited (“ALS”) preparation facilities in Chihuahua City, Mexico. After sample preparation in Chihuahua, sample pulps are shipped to ALS in North Vancouver, Canada for analysis. The remaining half core is retained on site. Samples sent for analysis are sawn half-core NQ or HQ in diameter and normally 2m in length but varied based on geological contacts. Samples are prepared using a method whereby the entire sample is crushed, and a subset is pulverized. Samples are analyzed for base metals and silver using inductively coupled plasma methods. Gold and overlimit silver are assayed using fire assay techniques. Sample batches include intermittent blanks, duplicates, and certified standards. The results of the assaying of the QA/QC material included in each batch are tracked to ensure the integrity of the assay data. ALS is a third-party independent laboratory.
Advertisement 22
Article content
Qualified Person
Scientific and technical disclosure in this press release regarding the Cerro Los Gatos 2024 Mineral Resource was based upon information prepared by or under the supervision of Ronald Turner, MAusIMM(CP), an employee of Golder Associates S.A. Scientific and technical disclosure in this press release regarding the 2024 Mineral Reserve, the 2024 LOM Plan and other economic analyses that will also be set out in the 2024 Technical Reports was based upon information prepared by or under the supervision of Stephan Blaho, P.Eng. an employee of WSP Canada Inc. Scientific and technical disclosure in this press release regarding the metallurgical assumptions for the 2024 LOM Plan and other economic analyses that will also be set out in the 2024 Technical Reports was based upon information prepared by or under the supervision of Adam Johnston, FAusIMM(CP), Chief Metallurgist with Transmin Metallurgical Consultants (UK). Other scientific and technical disclosure in this press release was approved by Anthony (Tony) Scott, P.Geo., Senior Vice President of Corporate Development and Technical Services of Gatos Silver. Each of Ronald Turner, MAusIMM(CP), Stephan Blaho, P.Eng., Adam Johnston, FAusIMM(CP), and Tony Scott, P.Geo. is a “Qualified Person,” as defined in S-K 1300 and NI 43-101. Ronald Turner, MAusIMM(CP), Stephan Blaho, P.Eng. and Adam Johnston, FAusIMM(CP) are all independent of Gatos Silver and the LGJV. Each Qualified Person has verified the data disclosed herein in respect of the subject matter associated with the Qualified Person identified above, including sampling, analytical, and test data underlying the related information or opinions.
Advertisement 23
Article content
Non-GAAP Financial Measures
The Company uses certain measures that are not defined by GAAP to evaluate various aspects of our business. These non-GAAP financial measures are intended to provide additional information only and do not have any standardized meaning prescribed by GAAP and should not be considered in isolation or as a substitute for measures of performance prepared in accordance with GAAP. The measures are not necessarily indicative of operating profit or cash flow from operations as determined under GAAP.
Cash Costs and All-In Sustaining Costs
Cash costs and all-in sustaining costs (“AISC”) are non-GAAP measures. AISC was calculated based on guidance provided by the World Gold Council (“WGC”). WGC is not a regulatory industry organization and does not have the authority to develop accounting standards for disclosure requirements. Other mining companies may calculate AISC differently as a result of differences in underlying accounting principles and policies applied, as well as definitional differences of sustaining versus expansionary (i.e. non-sustaining) capital expenditures based upon each company’s internal policies. Current GAAP measures used in the mining industry, such as cost of sales, do not capture all of the expenditures incurred to discover, develop and sustain production. Therefore, we believe that cash costs and AISC are non-GAAP measures that provide additional information to management, investors and analysts that aid in the understanding of the economics of the Company’s operations and performance compared to other producers and provides investors visibility by better defining the total costs associated with production.
Advertisement 24
Article content
Cash costs include all direct and indirect operating cash costs related directly to the physical activities of producing metals, including mining, processing and other plant costs, treatment and refining costs, general and administrative costs, and royalties. AISC includes total production cash costs incurred at the LGJV’s mining operations plus sustaining capital expenditures. The Company believes this measure represents the total sustainable costs of producing silver from current operations and provides additional information of the LGJV’s operational performance and ability to generate cash flows. As the measure seeks to reflect the full cost of silver production from current operations, new project and expansionary capital at current operations are not included. Certain cash expenditures such as new project spending, tax payments, dividends, and financing costs are not included.
Free Cash Flow
Management uses free cash flow (“FCF”) as a non-GAAP measure to analyze cash flows generated from operations. As used herein, FCF is cash provided by operating activities less cash used in investing activities. The Company believes that this measure assists in evaluating the Company’s ability to generate cash flow after capital investments. The most directly comparable measure prepared in accordance with GAAP is cash provided by operating activities. The Company believes FCF is also useful as one of the bases for comparing the Company’s performance with its competitors. Although FCF and similar measures are frequently used as measures of cash flows generated from operations by other companies, the Company’s calculation of FCF is not necessarily comparable to such other similarly titled captions of other companies. The Company is unable to provide without unreasonable efforts a reconciliation of forward-looking free cash flow on a per-year basis to cash flow provided by operating activities due to the inherent difficulty in forecasting and quantifying certain amounts, some of which may be material, that are necessary for such reconciliation.
Advertisement 25
Article content
Reconciliation of GAAP to non-GAAP measures
Table 9 below presents a reconciliation between the most comparable GAAP measure of the LGJV’s expenses to the non-GAAP measures of (i) cash costs, (ii) cash costs, net of by-product credits, (iii) co-product AISC and (iv) by-product AISC for the Company’s operations.
Table 9: Reconciliation of Cash Costs and AISC to Cost of Sales (as defined under US GAAP)(1,2,3,4,5)
| Cash Costs and All-In Sustaining Costs | Units | 2024 LOM Plan (H2’24+) |
2023 LOM Plan (H2’24+) |
||||
| Mining Costs | $M | $435.6 | $305.3 | ||||
| Milling Costs | $M | $256.0 | $185.6 | ||||
| Transportation Costs | $M | $148.7 | $99.9 | ||||
| Cost of Sales | $M | $840.2 | $590.8 | ||||
| Royalties | $M | $5.0 | $2.6 | ||||
| General and Administrative | $M | $157.1 | $123.7 | ||||
| Expenses | $M | $1,002.3 | $717.1 | ||||
| Treatment and Refining Costs | $M | $145.5 | $125.0 | ||||
| Cash Costs | $M | $1,147.8 | $842.1 | ||||
| Sustaining Capital | $M | $186.9 | $114.7 | ||||
| Accretion Expense | $M | $0.0 | $0.0 | ||||
| All-in Sustaining Costs (AISC)(1)(2) | $M | $1,334.7 | $956.9 | ||||
| By-product Credits(3) | $M | ($1,109.9) | ($729.1) | ||||
| Payable Silver | Moz | 45.5 | 37.4 | ||||
| Cash Costs before By-product Credits | $/oz Ag payable | $25.23 | $22.52 | ||||
| AISC before By-product Credits | $/oz Ag payable | $29.33 | $25.59 | ||||
| By-product Credits(3) | $/oz Ag payable | ($24.39) | ($19.50) | ||||
| Cash Costs, net of by-product credits | $/oz Ag payable | $0.83 | $3.02 | ||||
| By-product AISC(1) | $/oz Ag payable | $4.94 | $6.09 | ||||
| Payable Silver Equivalent(3)(4) | Moz | 93.8 | 70.5 | ||||
| Co-product Cash Cost | $/oz AgEq payable | $12.24 | $11.94 | ||||
| Co-product AISC(1) | $/oz AgEq payable | $14.24 | $13.57 | ||||
| Management Fee and Admin. Costs | $M | $61.2 | $42.3 | ||||
| By-product AISC(5) | $/oz Ag Payable | $6.29 | $7.22 | ||||
| Co-product AISC(5) | $/oz Ag Eq. Payable | $14.89 | $14.17 | ||||
Advertisement 26
Article content
(1) Excludes LGJV management fee and administration costs of approximately $7 million per year, equivalent to $1.35 / oz Ag payable and $0.65 / oz AgEq payable, respectively in the 2024 LOM Plan and $1.13 / oz Ag payable and $0.60 / oz AgEq payable, respectively in the 2023 LOM Plan.
(2) Excludes any exploration costs related to future resource expansion and conversion.
(3) Uses 2024 reserve price assumptions of $23.00/oz silver, $1.25/lb zinc, and $0.95/lb lead, $1,850/oz gold and $4.00/lb copper for the 2024 LOM Plan. Uses 2023 reserve price assumptions of $22.00/oz silver, $1.20/lb zinc, and $0.90/lb lead, $1,700/oz gold and $3.50/lb copper for the 2023 LOM Plan.
(4) Payable silver equivalent ounces include payable copper aligned to current payable terms for copper in lead concentrate and expected payable terms for copper concentrates.
(5) Includes LGJV management fee and administration costs of approximately $7 million per year in the 2024 LOM Plan and $6 million per year in the 2023 LOM Plan
Forward-Looking Statements
This press release contains statements that constitute “forward looking information” and “forward-looking statements” within the meaning of U.S. and Canadian securities laws. All statements other than statements of historical facts contained in this press release, including statements regarding production including potential production increases, cash flows, CLG’s life of mine and mine life extensions, mining rates and mill throughput rates, growth potential and margin improvement opportunities, mineral resource and reserve estimates, future prices for silver, zinc, lead, gold and copper, potential cash distributions to LGJV partners, NPV, projected capital, operating costs, sustaining and all-in sustaining costs, the exchange rate for the Mexican Peso to the U.S. Dollar, mine design, mine scheduling and mining methods including the proportion of LH stoping and filling methodologies, mining dilution and recovery estimates, timing of filing of updated 2024 Technical Reports, viability of potential modifications and projects to improve efficiency, timing of proposed drilling, potential results from exploration including possible increases to the LOM, and the timing of exploration updates are forward-looking statements. Forward-looking statements are based on management’s beliefs, assumptions, current expectations about future events and on information currently available to management including without limitation assumptions about commodity prices, mining methodologies, the accuracy of Mineral Reserve and Resource estimates, operating and capital costs, plant throughput and processing recoveries, operating conditions, and including other assumptions set out herein and to be set out in the 2024 Technical Reports. Such statements are subject to risks, uncertainties, and other factors that could cause actual results to differ materially from those expressed or implied in the forward-looking statements including without limitation, commodity prices, change in regulations, failure to retain or obtain permits and licenses, environmental risks, cost and timing of exploration, development and production, opposition to mining may arise, labour interruptions, other general risks associated with mining operations and such other risks and uncertainties described in our filings with the U.S. Securities and Exchange Commission and Canadian securities commissions. Further, although the Company has attempted to identify factors that could cause actual actions, events or results to differ materially from those described in forward-looking statements, there may be other factors that cause actions, events or results not to be as anticipated, estimated or intended. Gatos Silver expressly disclaims any obligation or undertaking to update the forward-looking statements contained in this press release to reflect any change in its expectations or any change in events, conditions, or circumstances on which such statements are based unless required to do so by applicable law. No assurance can be given that such future results will be achieved, and as such, readers should not place undue reliance on forward-looking statements. Forward-looking statements speak only as of the date of this press release.
Investors and Media Contact
André van Niekerk
Chief Financial Officer
[email protected]
(604) 424 0984
__________________
1 Includes LGJV management fee and administrative costs. Refer to Table 9 for AISC details.
2 See Non-GAAP Financial Measures below.
3 NPV is as of July 1, 2024 using a 5% discount rate. 2024 NPV and free cash flow assume reserve price assumptions of $23/oz silver, $1.25/lb zinc, $0.95/lb lead, $1,850/oz gold, $4.00/lb copper and a Mexican Peso exchange rate of MXN 20.00 per US$1.00. 2023 NPV used prices of $22/oz silver, $1.20/lb zinc, $0.90/lb lead, $1,700/oz gold, $3.50/lb copper and a Mexican Peso exchange rate of MXN 20.00 per US$1.00.
4 As of 16:00 Pacific time on September 24, 2024
5 NPV and free cash flow sensitivities presented here consider $30/oz Ag and $35/oz Ag, with other prices reflecting the 2024 reserve price assumptions described above. NPV is as of July 1, 2024 using a 5% discount rate.
6 Silver equivalent production for the 2024 LOM Plan is calculated using 2024 reserve price assumptions to “convert” zinc, lead, gold and copper production contained in concentrates to “equivalent” silver ounces (contained metal, multiplied by price, divided by silver price).
7 2024 Mineral Reserve and Mineral Resource figures as at July 1, 2024; 2023 Mineral Reserve and Mineral Resource figures as at July 1, 2023
Figures accompanying this announcement are available at
https://www.globenewswire.com/NewsRoom/AttachmentNg/05e3189f-3c45-4b8f-8a91-3531e1000019
https://www.globenewswire.com/NewsRoom/AttachmentNg/282b7682-e2fc-425d-a39c-b33a7f4789c1
https://www.globenewswire.com/NewsRoom/AttachmentNg/48b9b9b0-3774-404d-a89d-d43d4edace4f
https://www.globenewswire.com/NewsRoom/AttachmentNg/7a0f44d9-6f10-4ecd-82b6-fe52c9d49447
https://www.globenewswire.com/NewsRoom/AttachmentNg/75c7ad31-de0f-4c73-93a7-247d4ea8f03f
https://www.globenewswire.com/NewsRoom/AttachmentNg/db4dbc68-675b-4f3b-8a08-3896dc418961
https://www.globenewswire.com/NewsRoom/AttachmentNg/9d2fcfab-ecca-4cb3-ba37-24587d44655a


Article content